



Key highlights:
- The MNT price is testing key resistance near $0.46-$0.47 after moving back above the 4-hour SMA 100
- Mantle’s RWA ecosystem has grown to $210M+, led by yield-bearing strategies and asset-backed credit
- Active addresses and daily transfers have reached their highest levels on the chart, supporting the breakout attempt
The MNT price is trading near $0.4628, and this is one of the more interesting setups in the market right now. What’s catching my eye is that Mantle is not being talked about because of a meme narrative or a short-term hype cycle. The focus is on real-world asset activity, network usage, and a chart that is pressing against a major resistance level.
Mantle says that 96% of the real-world asset value on the network is in yield-bearing assets, and data from rwa.xyz shows total RWA value at $210.14 million as of August 11, 2026. Most of that capital is sitting in productive assets, including $118.56 million in active strategies, $53.55 million in asset-backed credit, and $29.06 million in U.S. Treasury debt.
Mantle’s RWA market has changed a lot
The rwa.xyz chart shows that the change over the last year and a half was hard to miss. At the start of 2025, Mantle had almost no meaningful RWA activity. Then, between April and June 2025, total value jumped from near zero to more than $200 million.
96% of RWA value on Mantle sits in yield-bearing assets, per @RWA_xyz.
Our asset landscape speaks for itself:
→ 56% active strategies
→ 25% asset-backed credit
→ 14% US treasuries
$201M of productive capital, by design, working wherever you are. pic.twitter.com/8gGLS591XI— Mantle (@Mantle_Official) August 12, 2026
After that initial jump, the market settled into a range of roughly $180 million to $250 million through early 2026. The more interesting development came later, when the asset-backed credit segment grew to more than $53 million.
That means Mantle is no longer relying only on tokenized Treasury exposure; it is hosting more sophisticated credit products and actively managed strategies. The encouraging factor is that the RWA value did not collapse during the broader crypto downturn. The capital on the network has been much stickier than typical retail crypto liquidity.
The MNT chart is pressing into resistance
We had a look at the MNT chart, and the short-term structure has improved noticeably. On the 4-hour timeframe, the MNT price has already moved back above the 100-period simple moving average at $0.4111. Price is now testing a descending resistance trendline around $0.46-$0.47.
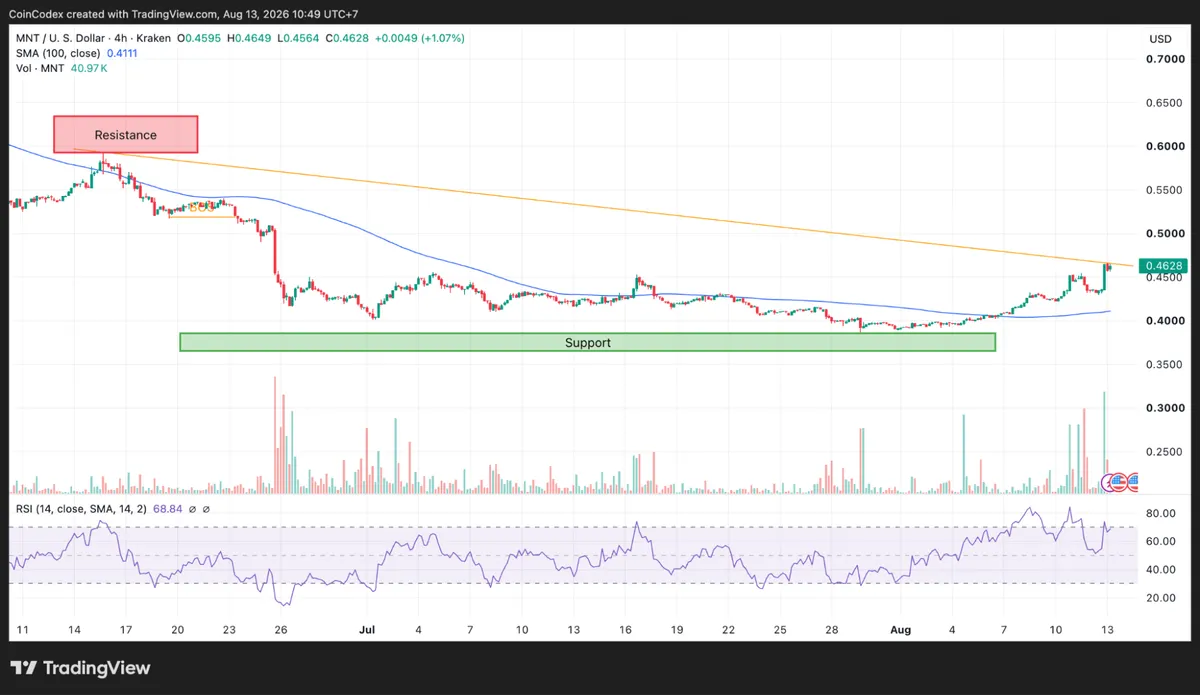
4-hour MNT chart analysis
The move from roughly $0.41 to $0.46 came with a clear increase in trading activity, and the 4-hour RSI is around 68.8. That’s bullish, although it is getting close to overbought territory, so a brief pause would not surprise me.
The daily chart is the one to pay closer attention to for the bigger trend. The daily SMA 100 is near $0.5142, and the MNT price is trading just below it. The long-term descending trendline from the 2025 peak near $3.50 is converging with that moving average between roughly $0.50 and $0.55.
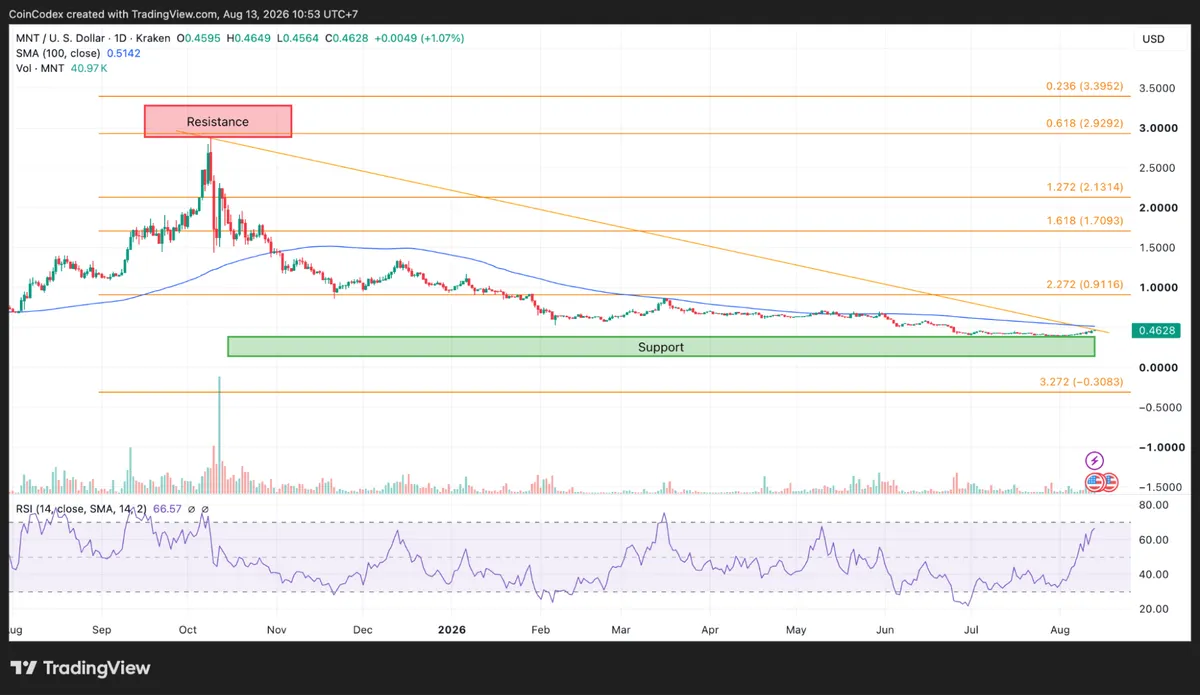
Daily MNT chart analysis
For me, $0.5142 is the key level. A daily close above that area would be the first convincing sign that the multi-month downtrend is starting to change.
Network activity is supporting the move
The on-chain data is what makes this setup more compelling. Active addresses on Mantle have climbed from roughly 130-150 addresses during the quiet phase to about 290 addresses, which is the highest reading on the chart.
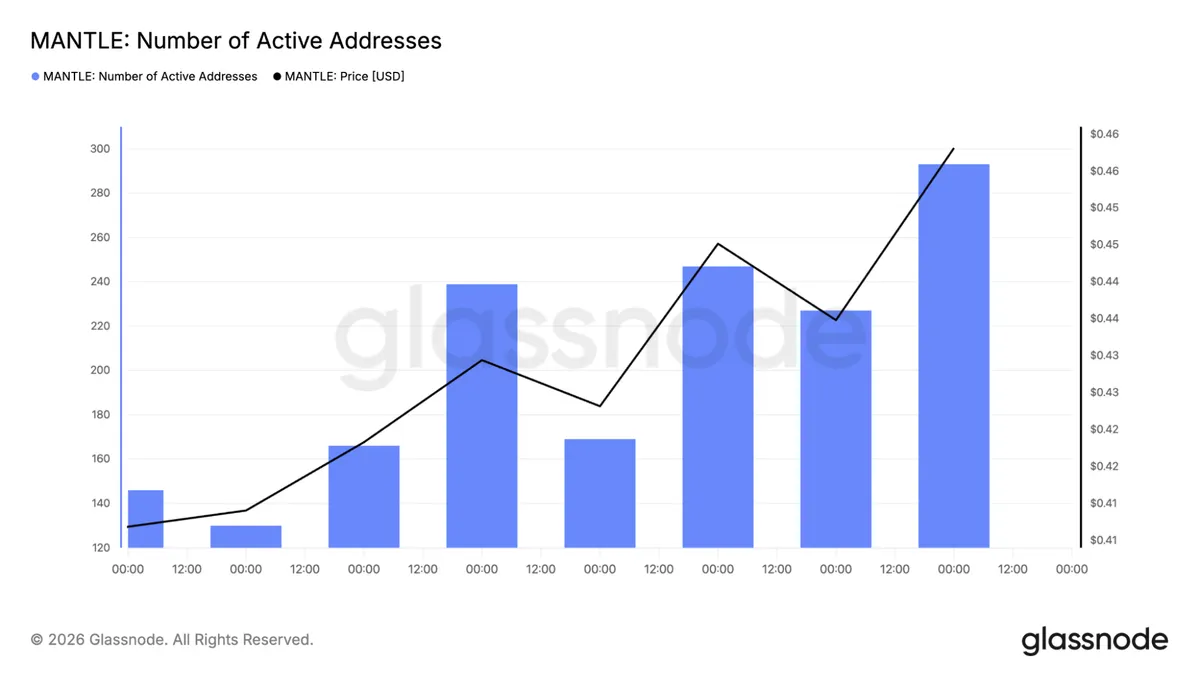
At the same time, the MNT price moved from around $0.41 to $0.46. Transfers show an even stronger change. Daily transfers increased from roughly 250 transactions to about 1,100 transactions, also the highest level on the chart.
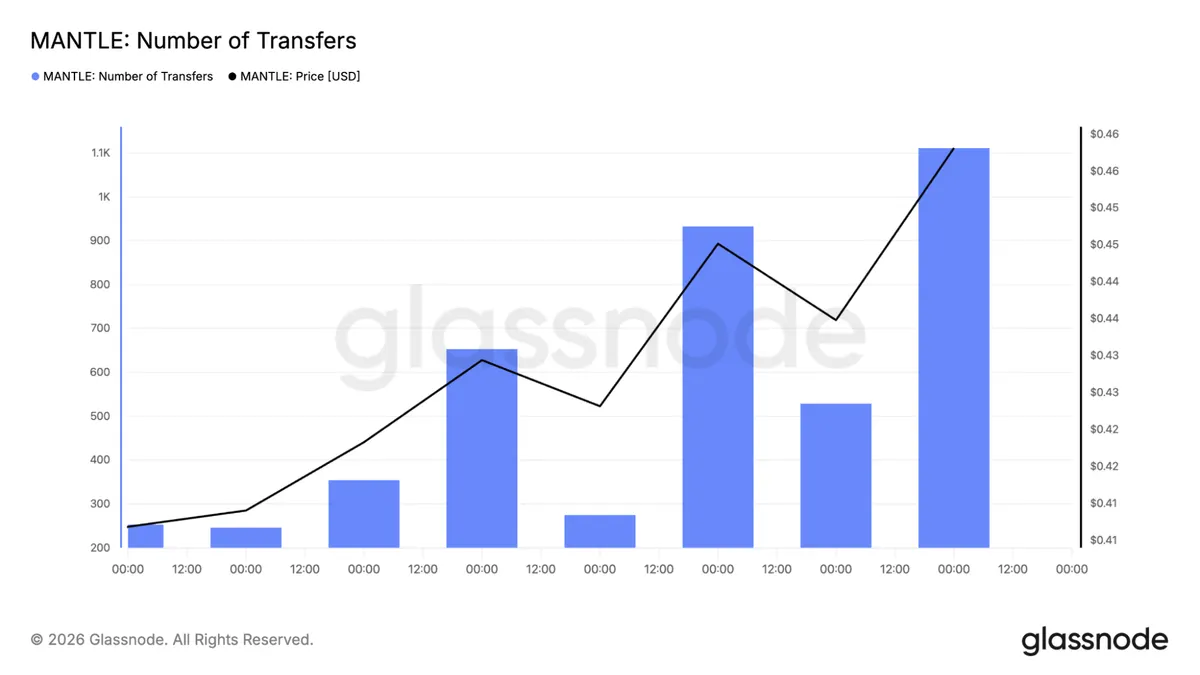
The important thing here is that both metrics rose alongside price. If this were just a single whale pushing the market higher, one would expect the price to rise without a similar increase in active addresses and transfers. Instead, both network participation and transaction throughput expanded sharply, which gives me more confidence that the move is being supported by real usage.
Why the RWA story matters for the MNT price
Mantle’s RWA growth and the on-chain activity are closely connected. More than $210 million in real-world assets means more users interacting with lending markets, treasury products, credit facilities, and active strategies. The jump in transfers to 1,100 transactions fits with that ecosystem becoming busier.
This is why the current setup feels different from many speculative altcoin rallies. The network is showing measurable growth in both capital deployed and transaction activity. That does not guarantee higher prices, but it does create a stronger fundamental backdrop than a rally driven purely by sentiment.
The MNT price climbed about 6.5% over the last 24 hours, trading near $0.464, and that’s noticeably better than what most of the broader crypto market has done during the same period. What stands out is the volume behind the move, there was an increase in trading volumes of 26.5% to about $34.65 million.
Whenever the price and volumes move up simultaneously, this is an indication of strong buying confidence. Mantle has also been retiring its legacy bridge infrastructure tied to roughly $2.5 billion in assets, part of a broader push toward more secure cross-chain systems.
Where could the MNT price go next
In the near term, the first trigger is a clean break above $0.47 on the 4-hour chart. If that happens and activity stays strong, the next target is the daily SMA 100 around $0.5142.
Above that level, the chart opens up considerably, with the next major resistance zone around $0.91. I would not jump straight to that target yet; the market still needs to prove it can break the daily trendline first.
The support side is easier to define. If the MNT price falls back below $0.4111, the immediate breakout setup weakens, and the next demand zone is roughly $0.35-$0.40. Mantle is testing a critical macro pivot. The MNT price is pressing against multi-month resistance, RWA value has grown to $210.14 million, active addresses are near 290, and transfers are near 1,100.
According to CoinCodex’s 1-month MNT price prediction, the price is projected to trade around $0.3435, which is below the current trading level near $0.46. That points to a cautious near-term outlook despite the recent breakout attempt.









