Key highlights:
- The LINK price remains below key moving averages despite major institutional partnerships.
- On-chain activity is weak, with active addresses and transfers both declining sharply.
- Attention remains on the $7.94 and $9.02 resistance zones as the LINK price attempts to recover.
The LINK price is in an interesting position right now. On one hand, Chainlink continues to secure new partnerships while growing further into the space of traditional finance, the token is yet to break free from a wider downtrend.
The LINK price is trading at around $7.84. This is a far cry from the $31.51 high seen on the 3-day chart shared by Crypto Rand, having declined by about 75% from this point. Even with new institutional use cases arriving, the market is still asking the same question: when will those fundamentals start showing up in the price?
$LINK marines pushing over the local downtrend seeking for the bullish reversal
More trading setups at: https://t.co/N3WuQcWWkm pic.twitter.com/aRJWaHwWP9— Rand Group (@randgroup) June 22, 2026
The LINK price still has technical work to do
We had a look at the LINK daily chart, and the broader trend remains under pressure. The LINK price is trading at $7.837, compared with the 100-day simple moving average at $9.019. In simple terms, LINK remains about 13% below one of its most important trend indicators.
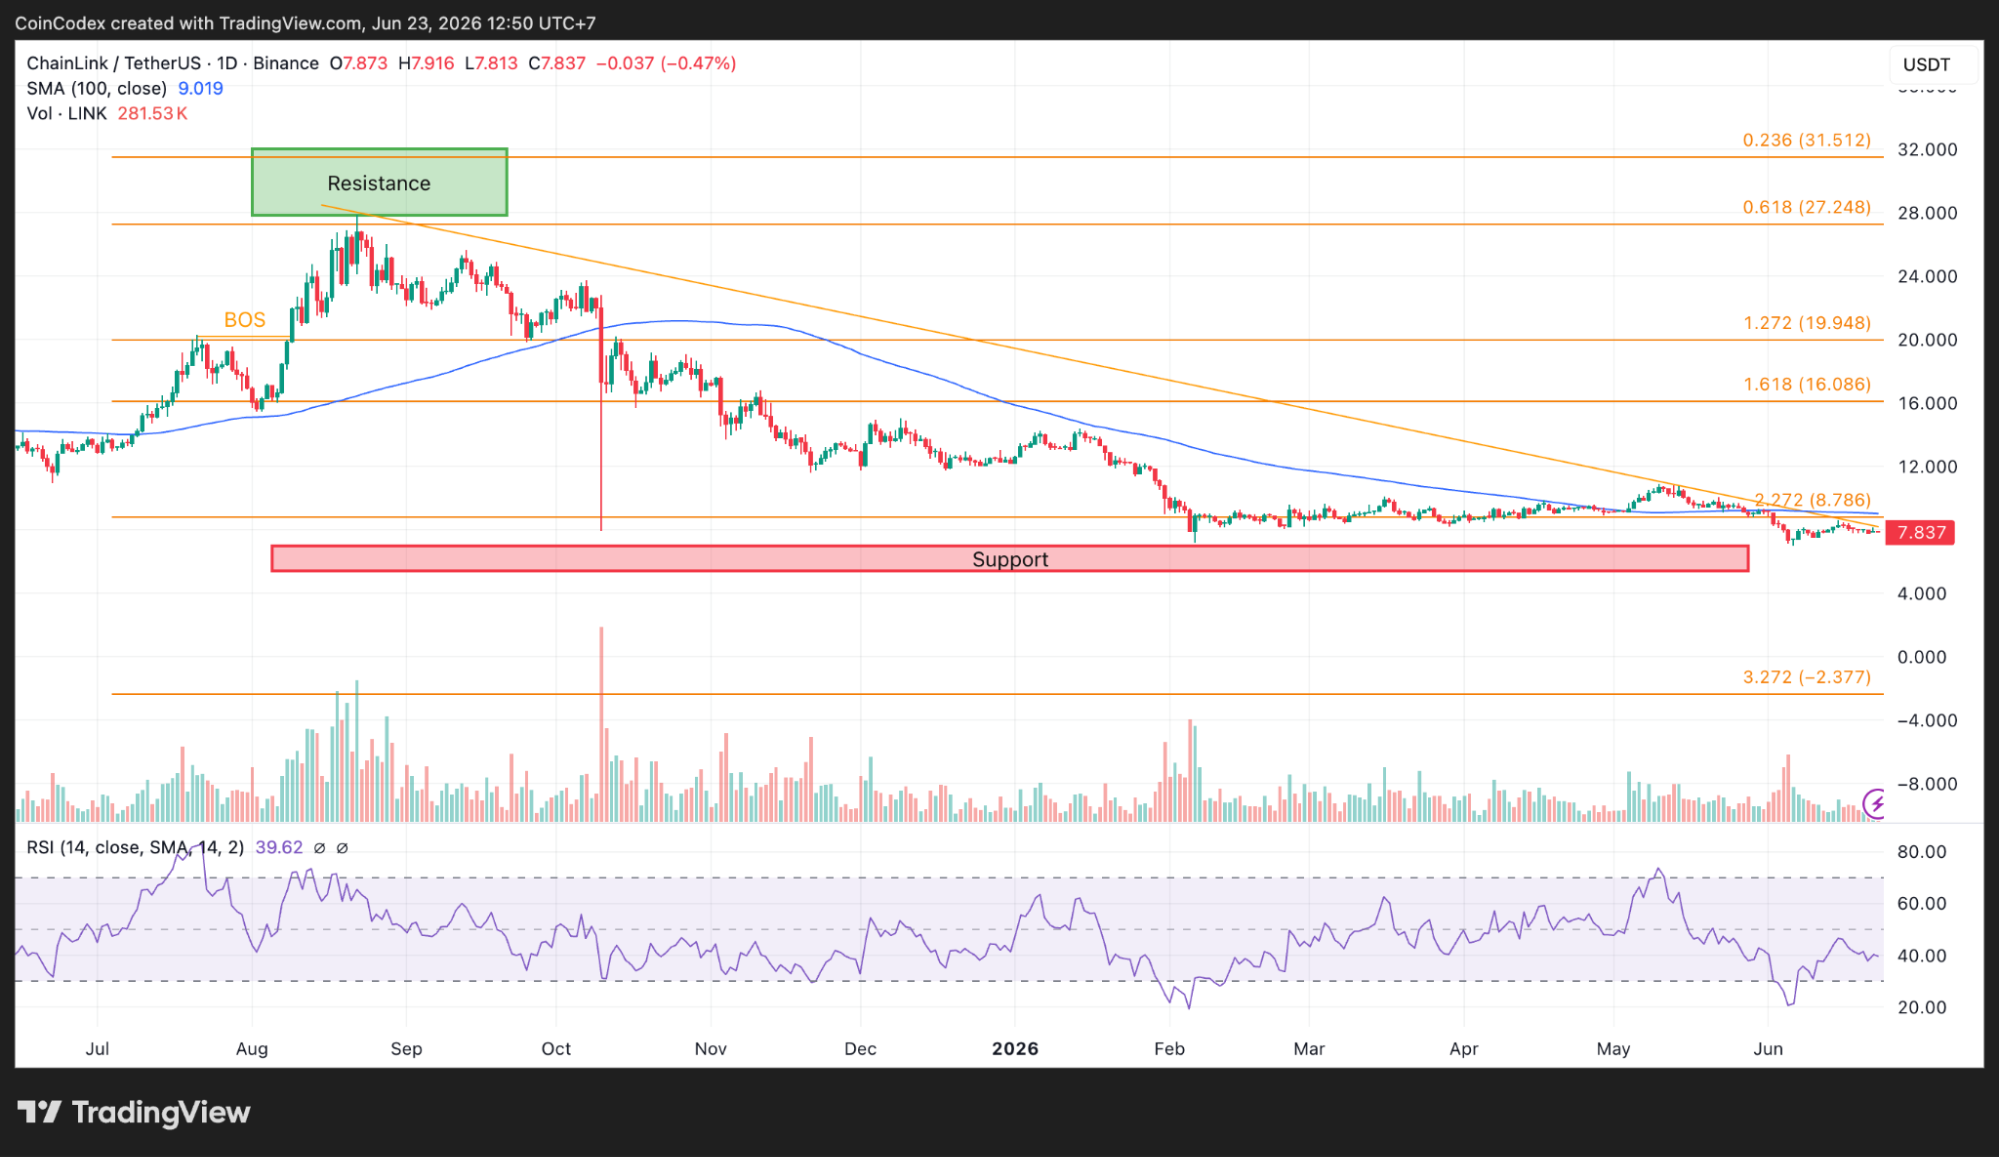
Daily LINK chart analysis
The moving average itself continues to point downward, which means the market has not fully escaped bearish conditions. The Fibonacci levels paint a similar picture. LINK is trading below the 2.272 extension level at $8.786, which means buyers have not yet managed to reclaim an area that traders often watch as an important technical zone.
Momentum indicators are not offering much relief either. The intraday RSI comes in at 39.62, which is below the neutral zone of 50. Support zones for now continue to be around $7.50 and $7.00. At the upper end, traders are monitoring the 100 day moving average close to $9.02 and after that $10.
The 4-hour chart shows the 100-period moving average at $7.943, and the LINK price is just below that level by 1.4%. That may not sound like much, but it matters because this moving average has acted as resistance throughout much of the recent trading range.
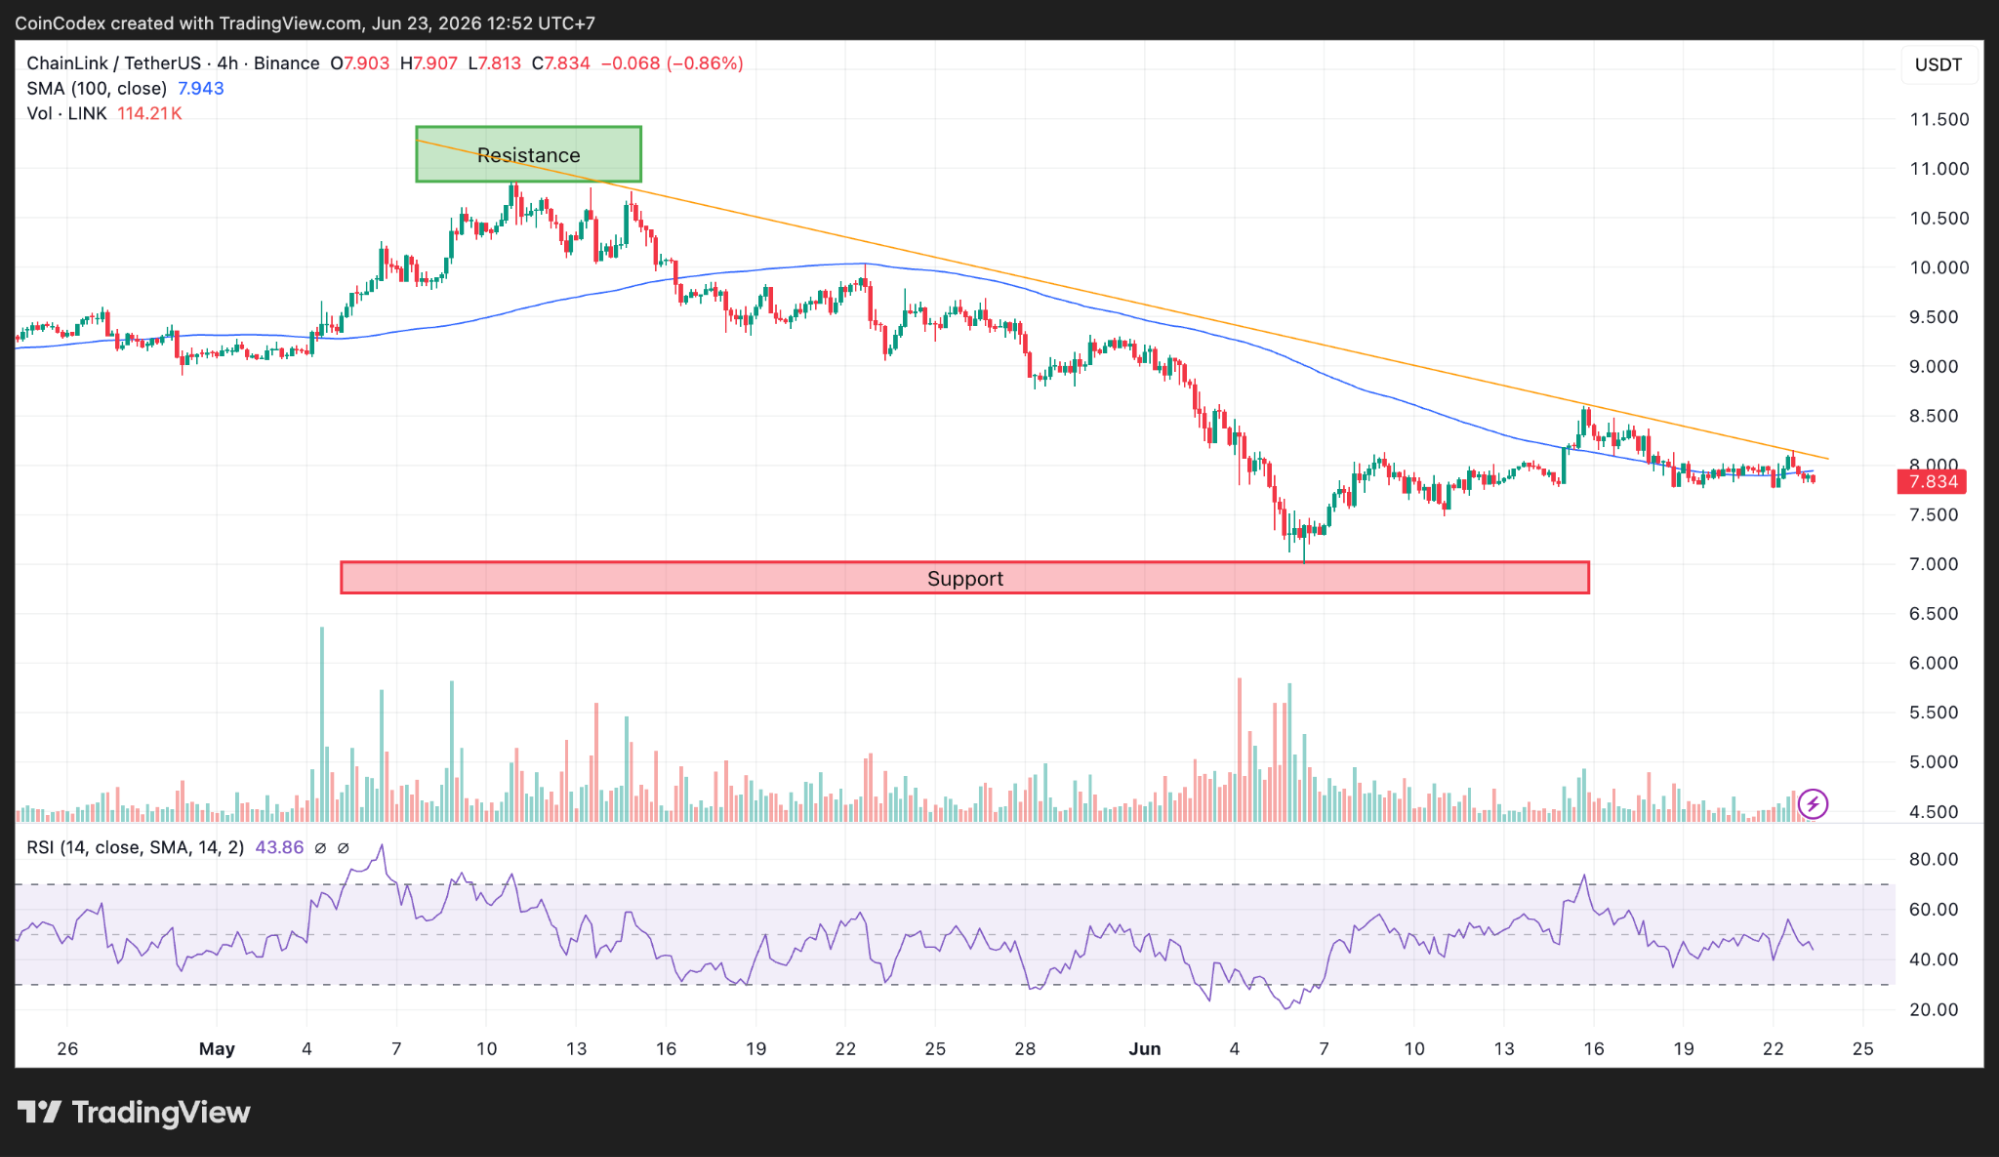
4-hour LINK chart analysis
A move above it could give buyers some breathing room and improve short-term sentiment. The 4-hour RSI is at 43.86, still below neutral but stronger than what we see on the daily timeframe. For now, LINK remains trapped between roughly $7.50 and $8.50.
Chainlink keeps expanding its reach
Away from the charts, Chainlink continues to add new use cases. One of the biggest developments is its role in the FIFA World Cup 2026 prediction markets. Chainlink has been selected as the oracle provider responsible for handling data and settlement for all 104 prediction markets linked to the tournament.
The company has also introduced APAC Equities Streams, which brings real-time stock market data from companies such as Samsung and Toyota onto blockchain networks. Then there is the ongoing work with traditional finance institutions.
Chainlink infrastructure has been involved in projects connected to the Depository Trust & Clearing Corporation (DTCC), particularly around collateral management and tokenized assets.
These developments matter because every service powered by Chainlink relies on its oracle network. More usage creates more demand for the network's services, which ultimately ties back to LINK's role within the ecosystem.
Network activity paints a different picture
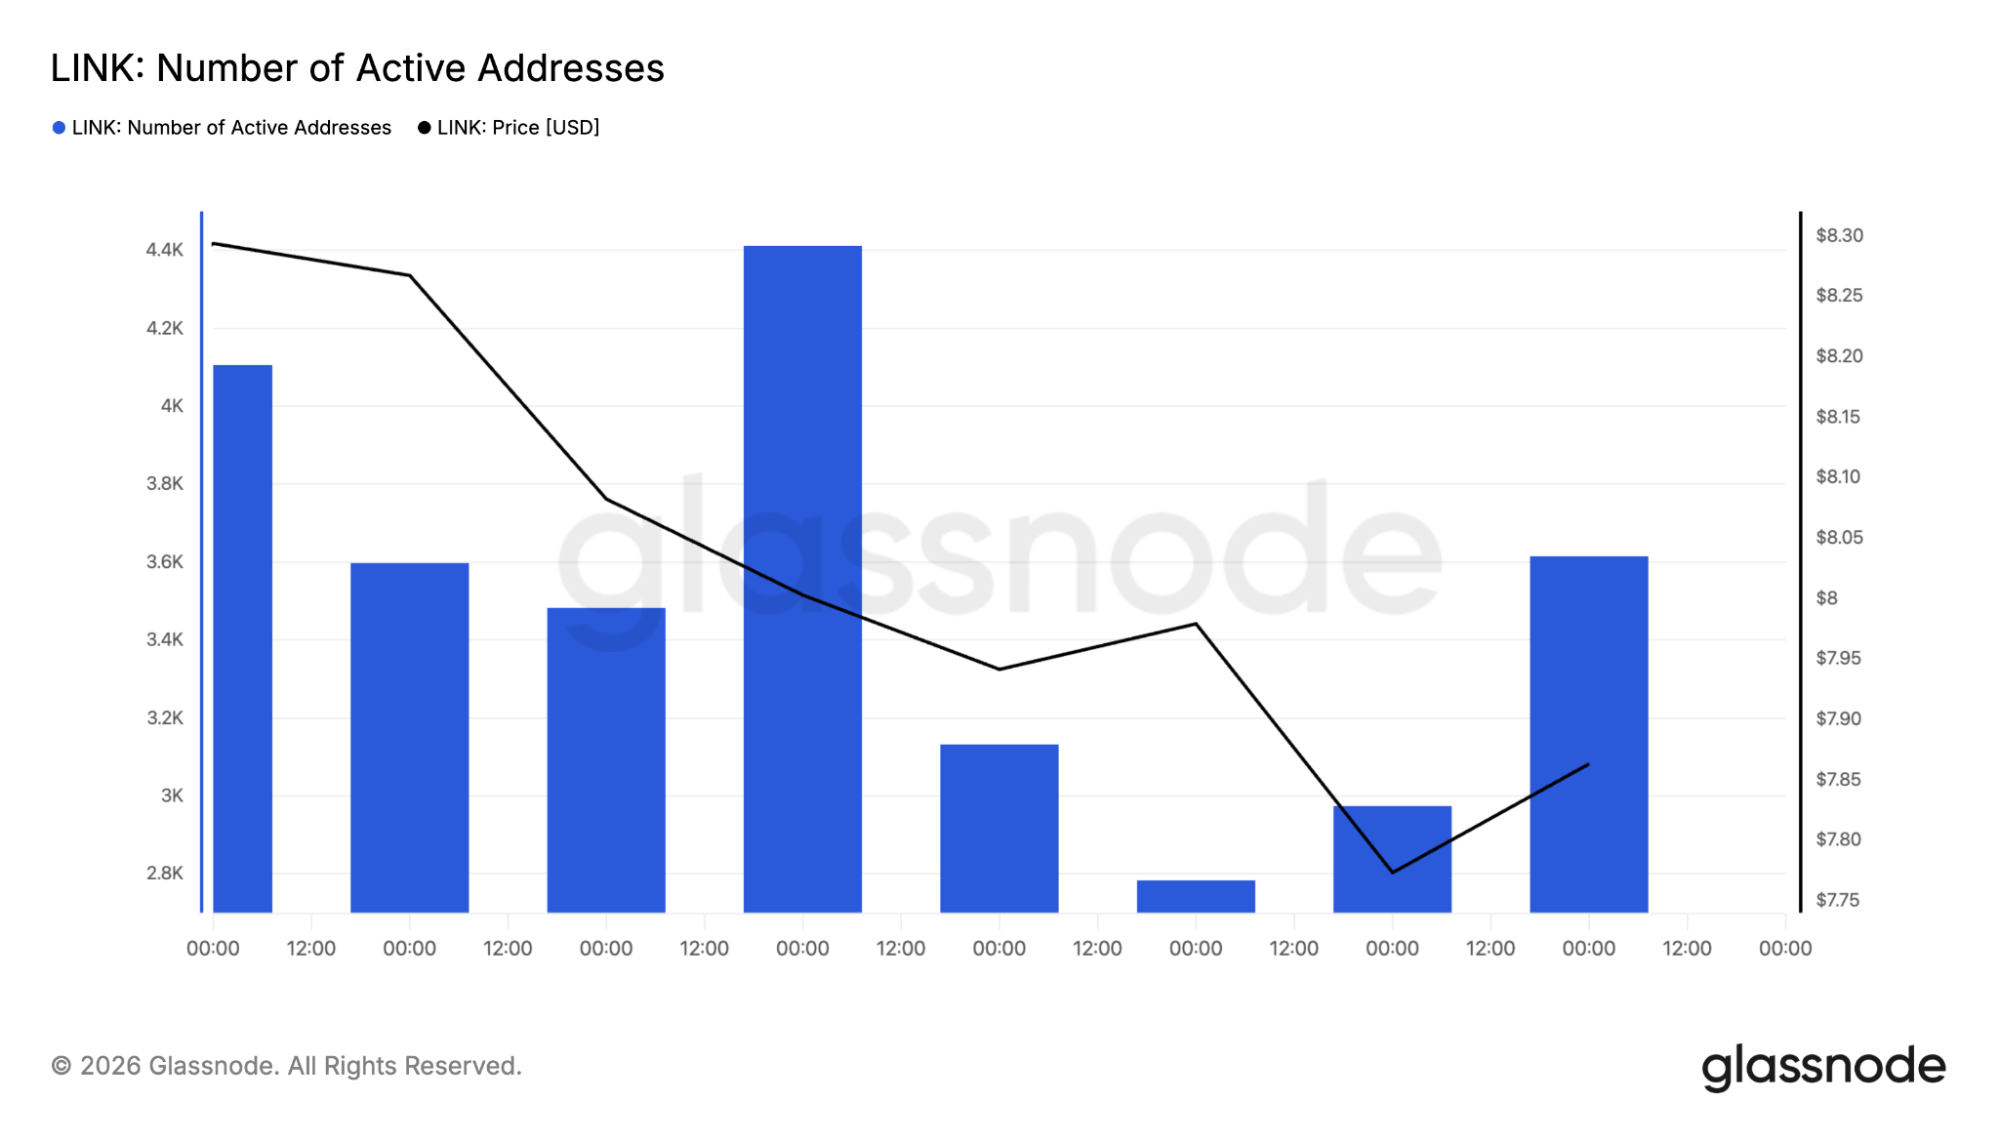
This is because there has been a trend in which the network activities are going against the positive trajectory. According to the Glassnode report, the number of addresses is reducing from around 4,400 to about 1,000 during the time under observation.
Transaction activity has weakened too. Daily transfers dropped from almost 10,000 to around 5,500, representing a decline of roughly 45%. Those numbers point to lower participation from users interacting directly with the network.
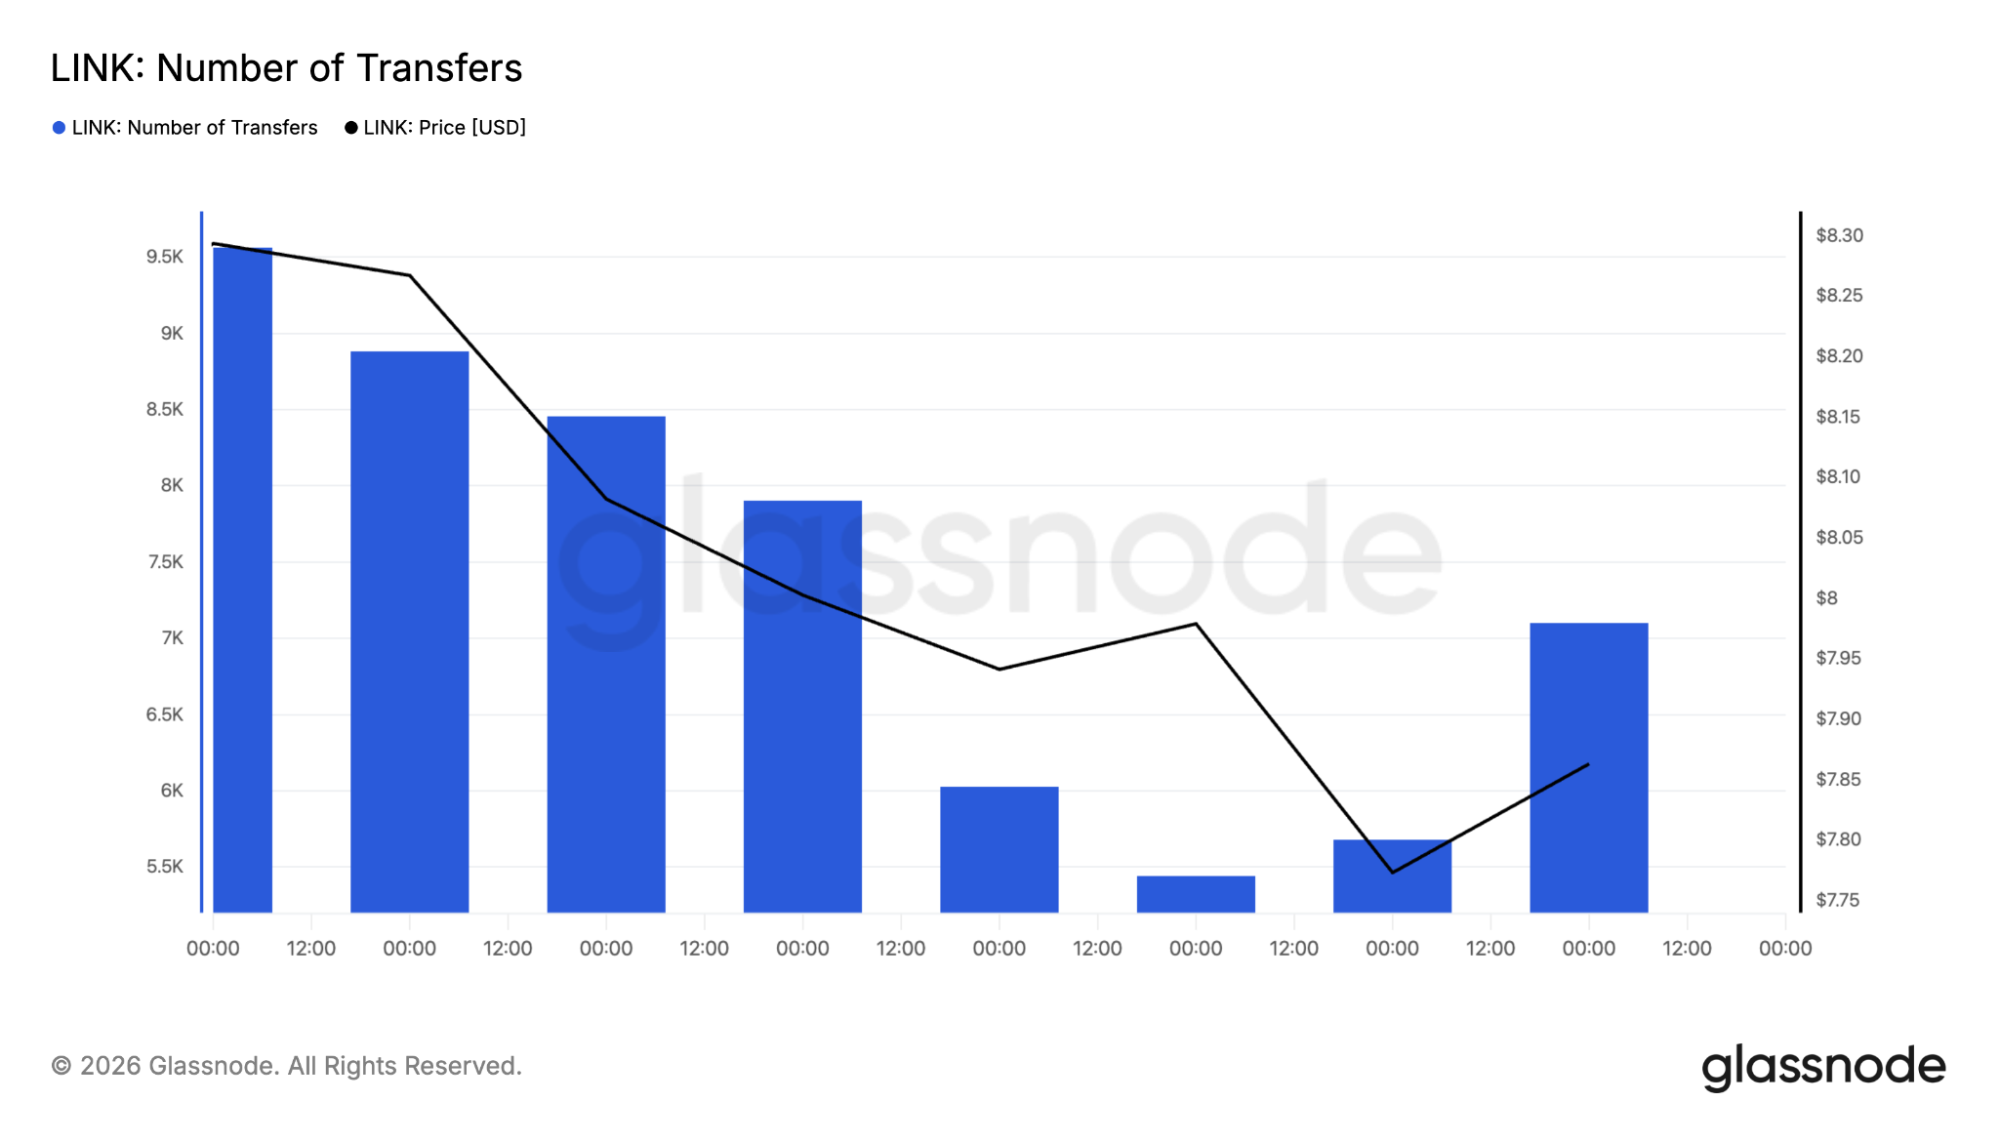
This creates an unusual situation where Chainlink's business development continues moving forward, but on-chain activity has yet to show the same level of growth.
Tokenomics could become a major talking point
Another area attracting attention is Chainlink's node economics. Chainlink Labs is hiring a Product Manager focused on node economics, which has led many community members to discuss possible updates to how LINK functions within the network.
At this stage, there is no official proposal. Nevertheless, the matter at hand is significant because any alteration to staking incentives or rewards may affect how investors feel about LINK. This is something that the market will watch out for in the coming months.
At the same time, token supply remains a factor. In June, around 18.375 million LINK tokens worth approximately $144.9 million were unlocked and transferred to Binance as part of Chainlink's scheduled release program.
Those unlocks increase circulating supply and can create selling pressure if demand is not strong enough to absorb the new tokens entering the market. That leaves the LINK price caught between accumulation from larger holders and additional supply entering circulation.
What comes next for LINK?
The LINK price remains stuck between improving fundamentals and a market that has not fully embraced them yet. Chainlink continues to expand through FIFA, stock market data services, tokenization initiatives, and traditional finance partnerships.
These moves increase the network's strength in the larger blockchain industry. On the other hand, the number of active addresses has decreased to almost 1,000 from 4,400 while the number of transactions is down to 5,500 from 10,000, while token unlock continues to increase supply.
A recovery above $7.94 MA and ultimately towards $9.02 would be bullish for bulls. A move below $7.50 would make bear target support zones lower. For now, the LINK price remains in a wait-and-see phase, with traders watching closely to see whether growing adoption can finally translate into stronger market performance.
CoinCodex’s 1-month LINK price prediction targets $8.98, indicating room for recovery from current prices if Chainlink can hold support and push back above major moving-average resistance levels.