



Key highlights:
- The XLM price is testing $0.20, with $0.23-$0.26 as the next upside zone
- Stellar's growing network activity continues to strengthen its broader market narrative
- Stellar's DTCC link and strong network activity add to the broader growth story
Stellar is starting to show signs of life again, and analysts believe the recovery may have more room to run. Crypto analyst More Crypto Online believes Stellar is still developing a bullish c-wave pattern, with potential upside toward the $0.23 to $0.26 range.
That outlook comes at a time when the XLM price is holding above key moving averages, maintaining positive momentum, and benefiting from growing interest in Stellar's role within the tokenized asset market.
With Stellar also linked to a future initiative involving DTCC, the world's largest securities settlement infrastructure, investors are beginning to ask whether XLM could be preparing for a larger breakout.
The XLM price is approaching a key decision point
More Crypto Online's chart analysis points to an ongoing recovery structure that could push the XLM price toward the $0.23-$0.26 region. We had a look at the XLM chart and found the token trading near $0.1899 on the 12-hour timeframe.
$XLM
XLM is still working on the c-wave to the upside, which could reach $0.23 - $0.26. pic.twitter.com/R2IgSO71iz— More Crypto Online (@Morecryptoonl) September 8, 2026
The first challenge for buyers remains the psychological $0.20 level. That resistance has repeatedly acted as a barrier, and clearing it could open the door to higher targets. Once the XLM price gets above $0.20, the next hurdles come in at $0.24, $0.28, $0.32, $0.36, and then $0.40.
The analyst’s c-wave target falls right inside the $0.23–$0.26 range, so this could be one of the key areas for XLM in the weeks ahead. Looking at the bigger picture, Stellar has already come a long way. The XLM price fell from around $0.40 to roughly $0.133 before finding some stability.
Since then, buyers have worked the token back up toward $0.19. There are several support levels underneath the market at $0.17, $0.155, $0.143, and $0.133. If buyers continue to defend these areas, the recovery setup stays intact.
XLM technical indicators continue to favor the bulls
The technical picture has improved across multiple timeframes. On the daily chart, the XLM price is around $0.1897, just above the 100-day SMA at $0.1856. We checked the shorter timeframe too, and XLM is above its 100-period SMA at $0.1838.
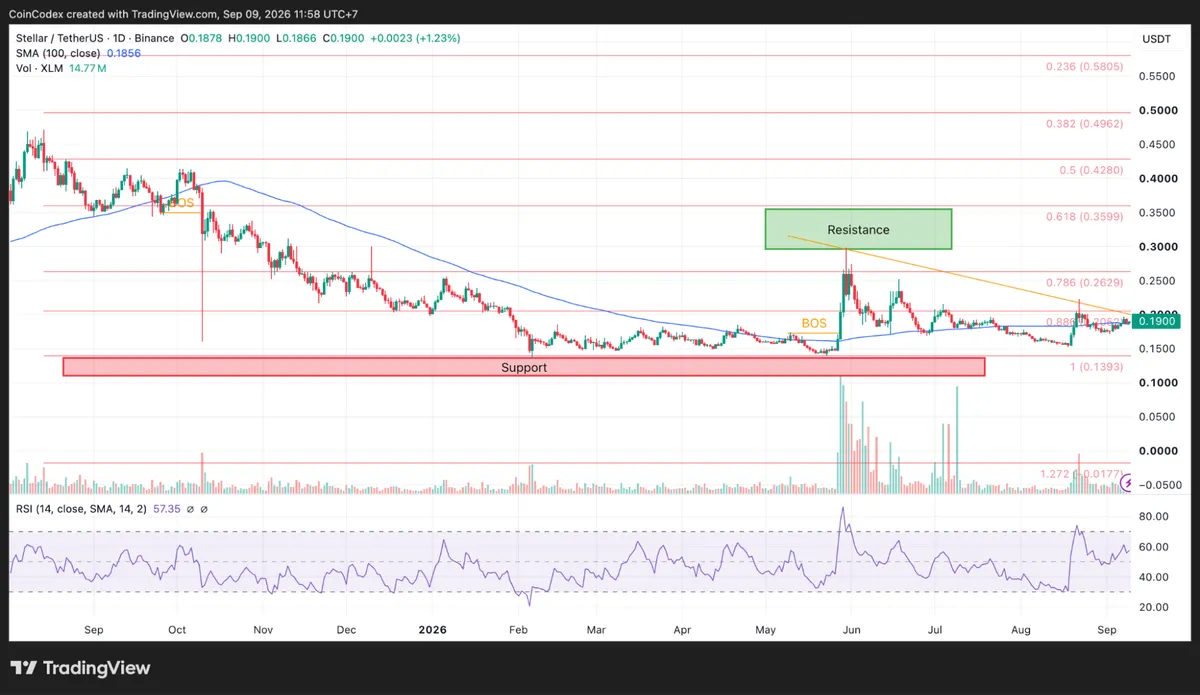
Daily XLM chart analysis
Keeping above both averages gives buyers a good base and shows that the trend is still leaning upward across both timeframes. The momentum numbers look healthy too.
The daily RSI is 57.35, and the 4-hour RSI is close to 55. Neither one is in overbought territory, so buyers still have some room before the market starts looking overheated. The first real test comes at $0.20–$0.21. A clean break above that zone could put $0.22, $0.23, $0.24, and $0.25 on the radar.
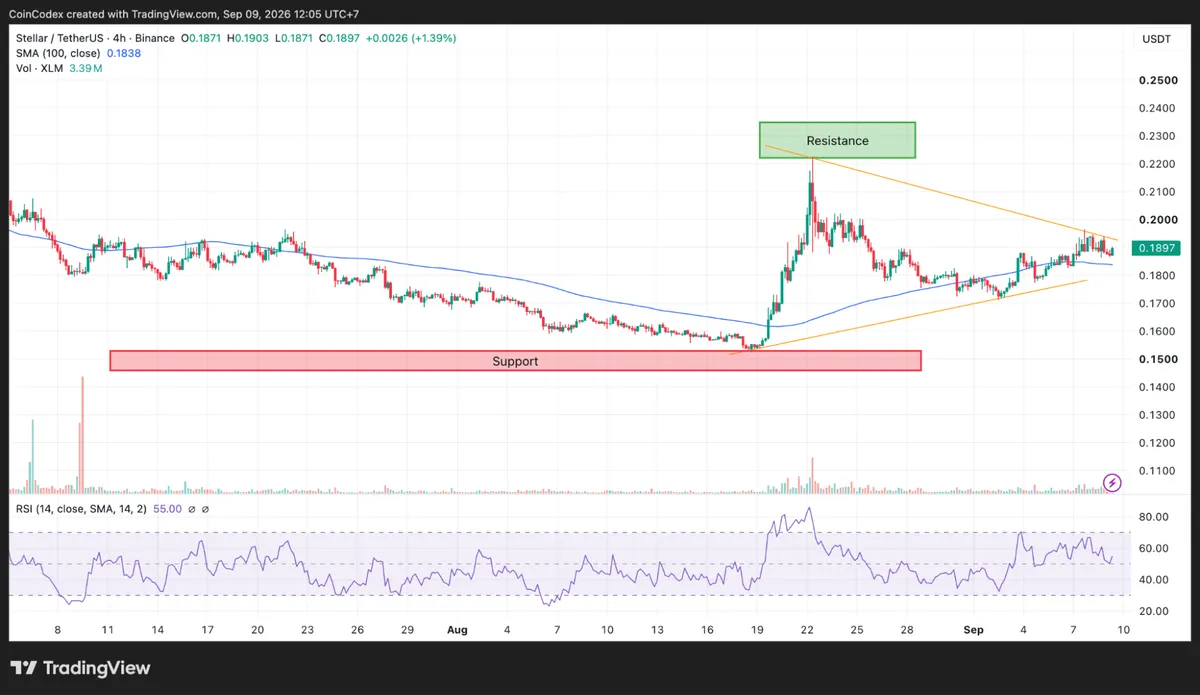
4-hour XLM chart analysis
If XLM keeps climbing beyond $0.25, the next Fibonacci levels are $0.2629, $0.3599, $0.4280, $0.4962, and $0.5805. For now, the chart structure continues to favor the recovery scenario outlined by More Crypto Online.
Stellar's DTCC connection could become a major catalyst
Beyond the charts, Stellar has a fundamental story that many investors are watching closely. Crypto analyst ALLINCRYPTO noted that DTCC and Stellar are preparing to bring DTC tokenized assets onto the Stellar network during the first half of 2027.
🚨FRIENDLY REMINDER: In less than 4 months the worlds largest financial infrastructure will start to tokenise it's assets on $XLM!
DTCC and @StellarOrg are preparing to bring DTC tokenised assets onto the Stellar network in the first half of 2027. 👀
DTCC’s depository provides… pic.twitter.com/KqkaWoQ0LL— ALLINCRYPTO (@RealAllinCrypto) September 8, 2026
The scale of that opportunity is hard to ignore. The scale of DTCC is hard to ignore. Its depository provides custody and asset services for more than $114 trillion worth of securities. Even if a small slice of that value eventually moves onto blockchains, it could still mean a huge amount of activity for the networks involved.
🚨Stellar just processed 11.6 MILLION transactions on Sunday alone!
Showing the network already being used at serious scale.
While much of crypto fights for attention, @StellarOrg is processing millions of transactions behind the scenes. $XLM pic.twitter.com/t3bciohwiE— ALLINCRYPTO (@RealAllinCrypto) September 8, 2026
There’s also plenty of activity happening on Stellar already. The same analyst pointed out that the network handled 11.6 million transactions in a single day. That’s a lot of traffic for one blockchain and shows that Stellar can process large amounts of activity without relying on future growth to prove its capacity.
On-chain data shows XLM is still trading at a deep discount
The on-chain data offers another interesting perspective. Stellar’s market cap is around $17 billion, putting XLM among the bigger names in crypto. Its market value has held within a range of roughly $6.1 billion to $17 billion, showing that investors still place a lot of value on the network even when the wider market gets shaky.
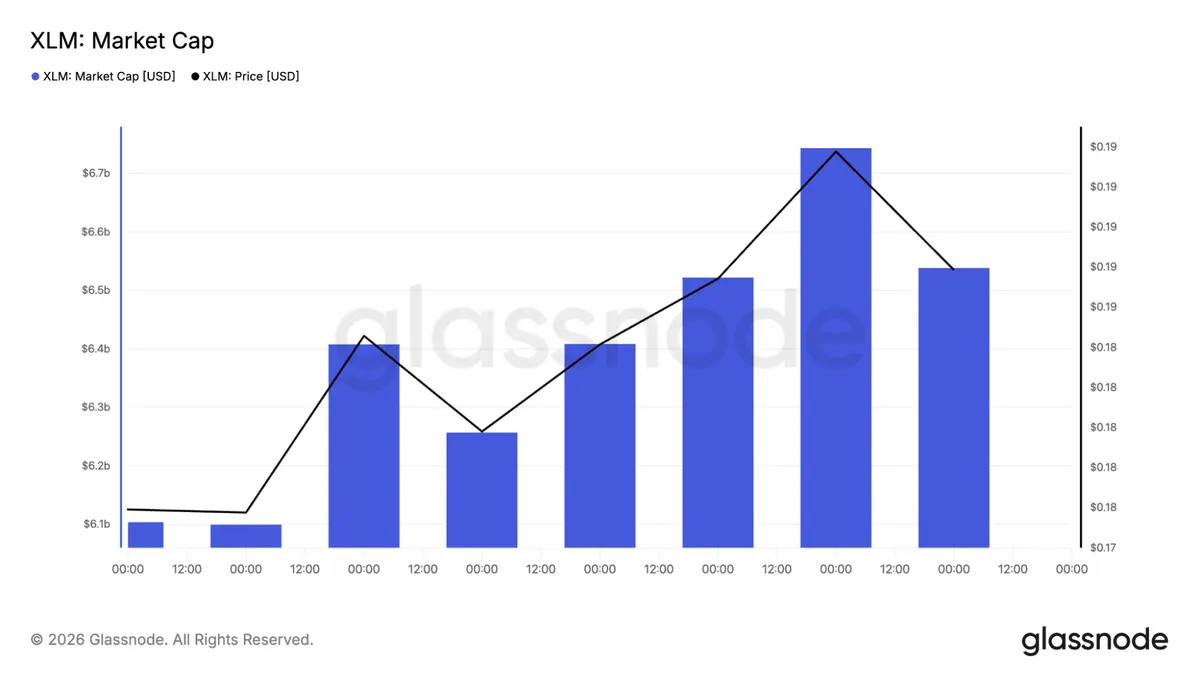
The distance from its all-time high is another point worth watching. The XLM price is still about 79.8% to 81.8% below its previous peak near $1.00. Even with the move from around $0.17 to $0.19, Stellar remains far below where it traded at the top of its previous cycle.
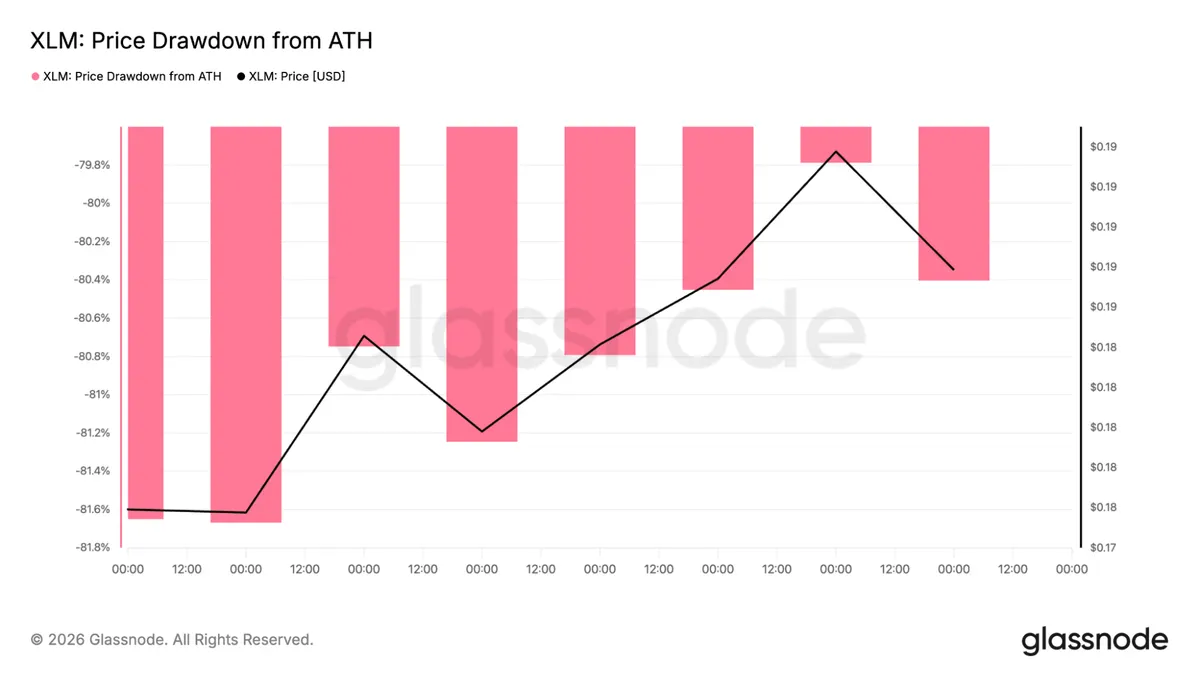
There has been some progress, though. The drawdown has improved from about 81.8% to 79.8% as XLM moves away from its recent lows. For a large-cap crypto, a recovery of this kind can be an important early step after such a deep decline.
Where could the XLM price go next?
The next major move will likely depend on whether buyers can finally push through the $0.20 resistance level. A clean breakout above that zone would give the c-wave target from More Crypto Online more room to play out, with the $0.23–$0.26 area becoming the next major target.
If buyers can keep pushing past that range, the next levels to watch are $0.28, $0.32, $0.36, and $0.40. There are clear support levels underneath too. The $0.1838–$0.1856 range lines up with the key moving averages, followed by $0.17 and $0.155 if XLM falls lower.
CoinCodex's 1-month XLM price prediction places the token around $0.2192. That target is above the current XLM price near $0.19, implying potential upside of roughly 15% from current levels.









