


Key highlights:
- The Gold price is testing key support between $4,200 and $4,214 after a steep pullback
- Oversold RSI readings could support a rebound toward $4,500 and $4,600
- Mining stocks continue outperforming Gold, showing strength across the metals sector
Gold has taken a beating lately. It dropped nearly 6% in just three sessions, and now everyone's wondering, is this the start of a bigger drop, or just a breather before another leg up? Most of the pressure came after Fed Chair Kevin Warsh doubled down on his inflation fight.
Bloomberg noted that rising bond yields and a stronger dollar pushed gold down to around $4,305. Meanwhile, fresh US-Iran tensions sent oil prices higher, adding more inflation worries to an already jittery market.
Even so, not everyone is convinced the correction has much further to go. GoldStockData founder Don Durrett believes Gold could still dip into the $4,100-$4,200 range before November, with $3,900-$4,100 remaining a possibility. His bigger view, though, is that this may be the final correction below $4,500 before the next major leg higher.
Gold is trading right on a key support zone
Some traders think the market may already be close to a turning point. Rashad Hajiyev pointed out that Gold tested a major horizontal support area where many late buyers had likely placed stop-loss orders. After that move, selling pressure began to ease.
Gold tested horizontal support where most of the late buyers placed their stops - cleansed.
Furthermore, 4-hour RSI formed a positive reversal (Andrew Cardwell) dipping into an oversold territory. While gold made a higher high, RSI formed a lower low suggesting that sellers are… pic.twitter.com/XpB0o4xrSQ— Rashad Hajiyev (@hajiyev_rashad) September 2, 2026
He also noted that the 4-hour RSI formed a positive reversal pattern. In simple terms, momentum is starting to improve even though price action remains weak. That type of setup often appears when sellers are running out of steam.
The most important area right now is the support zone between $4,200 and $4,214. This region combines a key Fibonacci level at $4,214 with the psychological $4,200 support area. The Gold price remains below its 100-day moving average at $4,360.84 and below the 4-hour SMA 100 at $4,475.43.
Still, one thing stands out. The 4-hour RSI has dropped to 24.41, which is deep in oversold territory. Readings below 30 often appear near the end of aggressive selloffs. It doesn't guarantee an immediate rally, but it does show that downside momentum may be becoming exhausted.
Mining stocks are acting much stronger than Gold
One reason some investors remain optimistic is the behavior of mining stocks. Even during Gold's decline, mining ETFs moved higher. GDX gained 3.36% to $95.20, GDXJ climbed 3.80% to $123.07, SIL rose 3.25% to $94.77, and SILJ advanced 3.67% to $30.19.
Gold down $120. The bull likes to buck. Hang on tight. $4100 to $4200 incoming before November. $3900 to $4100 is in play, but my hunch is that we don't go that low.
This is likely the last correction at these levels for gold (sub $4500). So, this is last call, last chance to… pic.twitter.com/N1N0YRW7FD— Don Durrett - goldstockdata.com (@DonDurrett) September 1, 2026
What's interesting is that junior miners outperformed the bigger companies. That's usually a sign of more aggressive bullish sentiment, investors tend to rotate into juniors when they expect metal prices to keep climbing.
The strength wasn't just in miners either. Silver held near $67, Platinum around $1,820, Palladium close to $1,360, and Copper tested $6.59. Most major metals are sitting near the top of their recent ranges. That broad participation across the sector is worth paying attention to. It shows investors are still interested in commodities even as Gold works through its correction.
Higher interest rates remain the biggest obstacle
The biggest challenge for the Gold price continues to be interest rates. Warsh's latest comments reinforced expectations that rates may stay elevated if inflation remains stubborn. That's generally a headwind for Gold because higher yields make bonds and other income-producing assets more attractive.
Gold held a decline as attacks in the Middle East and a global bond selloff ratcheted up bets the Federal Reserve may need to raise interest rates to rein in inflation https://t.co/7vvIv9pdRc
— Bloomberg (@business) September 2, 2026
We've seen that relationship play out during this correction. Bond yields climbed, the dollar strengthened, and gold took a hit. The Middle East situation just adds more uncertainty. Higher oil prices can keep inflation hot, which gives central banks more reasons to keep rates higher for longer.
That's why a lot of traders are still cautious, even with oversold conditions popping up on the shorter timeframes. The macro picture is still messy. For now, the market is balancing two competing forces. Rising yields are weighing on Gold, but oversold momentum readings and continued strength across the metals sector are helping support prices.
Gold chart analysis
We had a look at the Gold charts and found the metal trading around $4,323, just above a major support zone between $4,200 and $4,214. This area has become the key level bulls need to defend if they want to stop the recent decline.
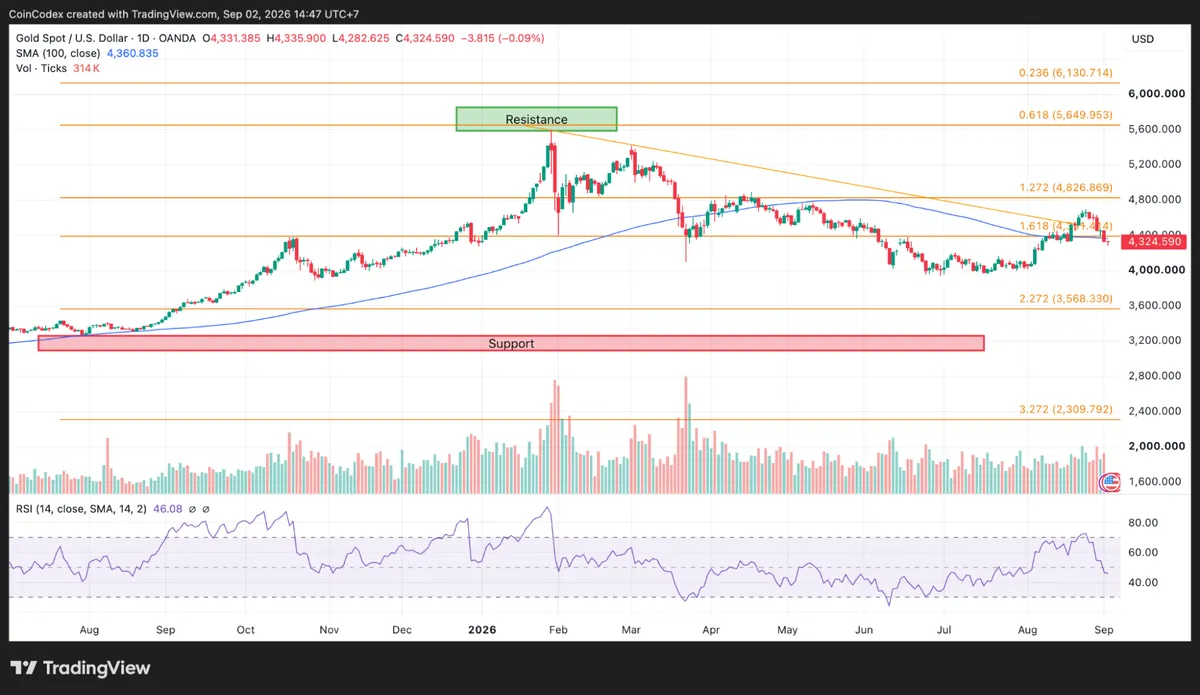
Daily gold chart analysis
The broader trend remains weak, with the Gold price trading below its 100-day moving average at $4,360.84 and the daily RSI sitting at 46.08. That shows sellers still have a slight advantage on the higher timeframe.
The shorter-term picture is more encouraging. The 4-hour RSI has dropped to 24.41, putting Gold in deeply oversold territory. Readings this low usually show up when selling starts to fade and a bounce gets more likely.
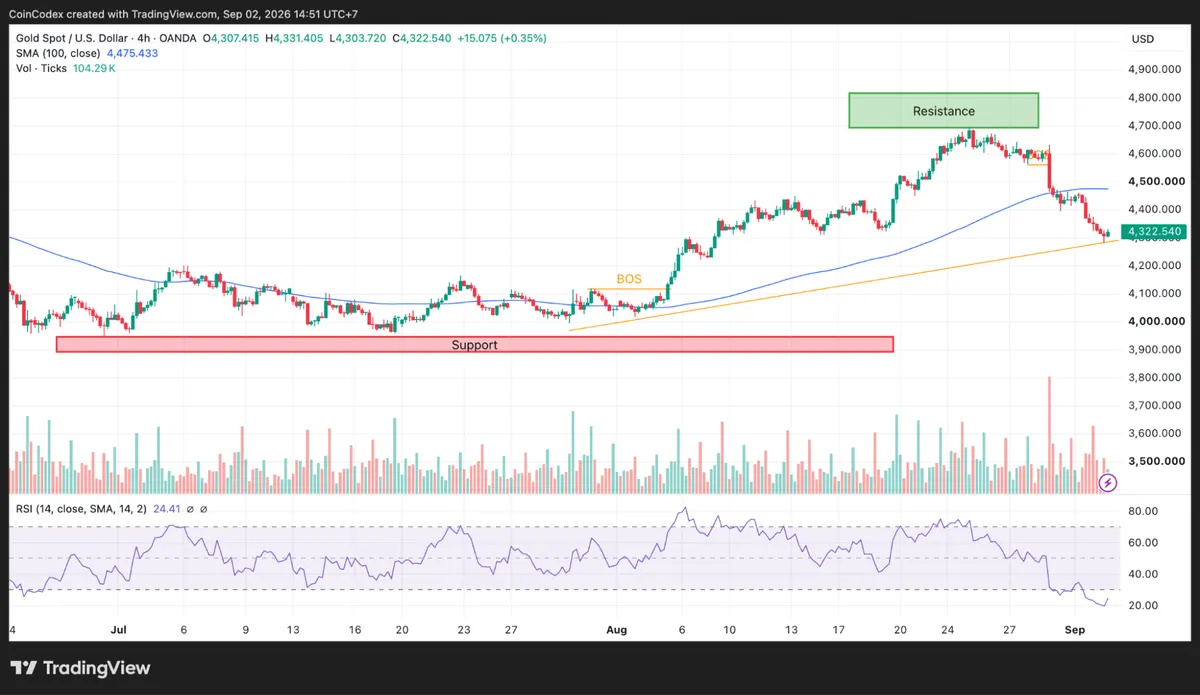
4-hour gold chart analysis
If buyers hold the $4,200–$4,214 support zone, the first target is around $4,475, then $4,500 and $4,600. If support breaks, attention shifts quickly to $4,100 and then the psychological $4,000 level. Right now, gold is sitting at a critical level. How it reacts here could decide the next major move.
Where could the Gold price go next?
The next few days probably come down to one number: $4,200. If buyers hold the $4,200–$4,214 zone, the first target is $4,475, where the 4-hour SMA 100 sits. Break above that, and $4,500 comes into play, then $4,600 and $4,700.
Bulls have a couple things going for them: the RSI is oversold at 24.41, and Hajiyev pointed out a positive reversal pattern. But if $4,200 breaks, things get ugly fast, $4,100 comes next, then the psychological $4,000 level. A deeper drop could even bring $3,900 or $3,800 into view. So this is a big one.
CoinCodex's 3-month Gold price forecast places the metal around $5,290.38. That target is well above the current price near $4,320-$4,330 and would imply a breakout above key resistance levels at $4,500, $4,600, and $4,700 that traders are closely watching.








