



Key highlights:
- Cardano's active addresses are near 497,840, but some analysts remain concerned about network growth versus rivals
- The ADA price is trading below key resistance at $0.2003 as traders watch for a breakout
- CoinCodex forecasts ADA at $0.1916 in one month, slightly below its current price
Cardano finds itself at an interesting crossroads as the ADA price trades near $0.1965, and the chart is showing signs that sellers may be losing momentum. But a recent discussion around network activity has raised fresh questions about the strength of the ecosystem.
Crypto analyst Joao Wedson took a closer look at active address data across Bitcoin, Ethereum, TRON, and Cardano. His conclusion was that these networks are heading in very different directions when it comes to user activity, and Cardano is the one that concerns him the most.
Why this Cardano metric matters
Wedson pointed out that Bitcoin's on-chain activity hasn't kept up with its price growth over the years. But that doesn't mean Bitcoin is losing its relevance. A lot of investors now hold through ETFs, custodians, exchanges, and other platforms, which means fewer transactions actually hit the chain. The activity is still there, it's just happening off-chain.
Ethereum is telling a different story. Active addresses are climbing back toward the 1 million mark despite a large portion of activity taking place on Layer-2 networks. TRON stands out even more, with more than 4 million active addresses, helped largely by stablecoin transfers and payment activity.
There’s a very interesting divergence happening between Bitcoin, Ethereum, TRON, and Cardano when we look at active addresses.
And I don’t like interpreting this metric in isolation.
With Bitcoin, for example, onchain activity has dropped significantly compared to previous… pic.twitter.com/8ESJglNy1N— Joao Wedson (@joao_wedson) August 30, 2026
Cardano is where the debate starts. Wedson believes network activity has not matched the expectations many investors had for the ecosystem, which raises concerns about how much real usage is happening beneath the surface.
The interesting part is that the chart itself doesn't paint a completely negative picture. Cardano's active addresses are sitting near 497,840, one of the strongest readings in the data. Activity has been trending up since late 2023, and the 30-day moving average is still climbing and that points to growing participation across the network.
The ADA price is still stuck below resistance
Even with healthy network activity, the ADA price still has technical hurdles to overcome. We had a look at the ADA chart and found the token trading just below its 100-period simple moving average at $0.2003. That level has become the most important resistance in the short term.
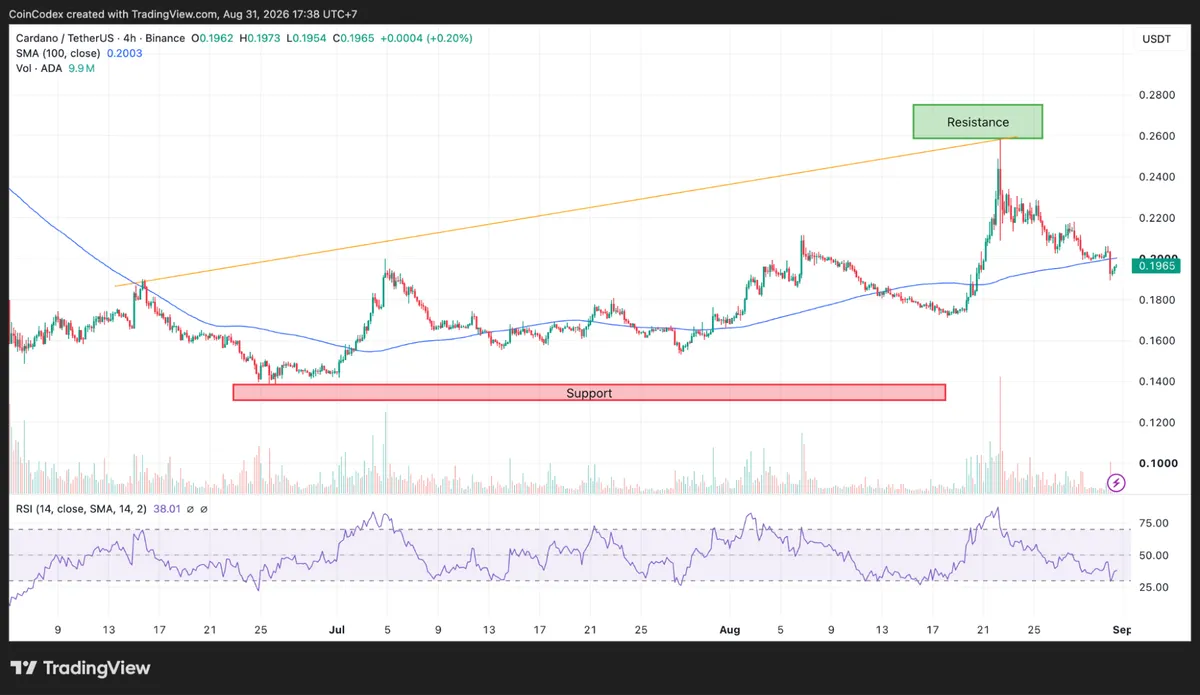
4-hour ADA chart analysis
Price action has tightened considerably, with ADA moving between $0.1954 and $0.1973 during the latest trading session. Volume came in at around 9.9 million ADA, enough to show participation but not enough to confirm a breakout attempt.
Momentum indicators are beginning to improve. The RSI is sitting at 38.01, which places ADA close to oversold territory. Readings in this area often appear when selling pressure starts to fade, although buyers still need to prove they can regain control.
Can the ADA price push higher?
Right now, it all comes back to $0.2003. If ADA can reclaim that SMA 100, the next resistance levels are $0.2200 and $0.2400. A stronger move could open the door to $0.2600 and $0.2800.
If buyers can't break through, support sits at $0.1800. Lose that, and $0.1600 and $0.1400 come into view. For traders, the move above or below $0.2003 could be the clearest signal yet about where ADA is headed next.
According to CoinCodex’s 1-month ADA price prediction, Cardano is projected to trade around $0.1916 over the next month. That target sits just below the current price near $0.1965 and would keep the ADA price under the important $0.2003 resistance level that traders are closely watching.









