



Key highlights:
- DOGE broke above a year-long downtrend and is holding key support between $0.083 and $0.0868
- DOGE/BTC has returned to a historical support zone that preceded major rallies in 2017 and 2021
- Active addresses climbed from 36.2K to 43K, while improving DOGE ETF inflows point to renewed market interest
Dogecoin is coming to the radar again, but not because of a meme-driven rally. This time, traders are looking at a combination of long-term chart patterns, improving ETF flows, and rising on-chain activity that could support a larger move higher.
Crypto analyst Cryptollica believes Dogecoin may be sitting near the same type of setup that appeared before its major rallies in 2017 and 2021. The idea comes from a long-term DOGE/BTC chart.
It shows DOGE is back at a historical support zone, the same area where previous cycle bottoms formed. At the same time, DOGE already broke above a major downtrend against the US dollar. So bulls have something real to work with now, not just hope.
DOGE/BTC returns to a key historical zone
Cryptollica is looking at the DOGE/BTC pair, not the dollar price of Dogecoin. The monthly chart goes back over a decade. It shows DOGE moving inside a descending channel that has guided its long-term cycles.
EVERYONE WANTS THE LIFE CHANGING GAIN
ALMOST NOBODY BUYS WHERE IT BEGINS.
DOGE/BTC monthly.
Fear is everywhere. Rsi is sitting on a major historical floor.
Everyone wants the explosion. Very few are willing to own the setup before it happens.
opportunity may be right here.… pic.twitter.com/gSrUSCBLhR— Cryptollica (@Cryptollica) August 25, 2026
The lower boundary of that channel has been key before. Dogecoin touched that area before the big 2017 rally. The DOGE/BTC ratio is back at 0.00000002 BTC. Same zone that preceded the 2017 rally. Same zone that set up the 2021 explosion. It's also testing a horizontal support that's been there for nearly nine years. History is literally repeating itself.
The logic is simple. Every time Dogecoin has hit this area in past cycles, a massive rally followed. That doesn't guarantee it'll happen again. But it explains why traders are watching closely.
To flip the script entirely, DOGE/BTC needs to break above 0.0000001 BTC. That would be the first real signal that the multi-year downtrend is finally over. Until then, it's just a setup waiting for confirmation.
The DOGE price has already broken out
The long-term DOGE/BTC chart may be pointing toward a possible cycle bottom, but the DOGE price itself has already delivered a bullish signal. We pulled up the DOGE chart. Right away, you can see it broke above a descending trendline that had been holding it down since October 2025. That happened after weeks of chopping between $0.065 and $0.075.
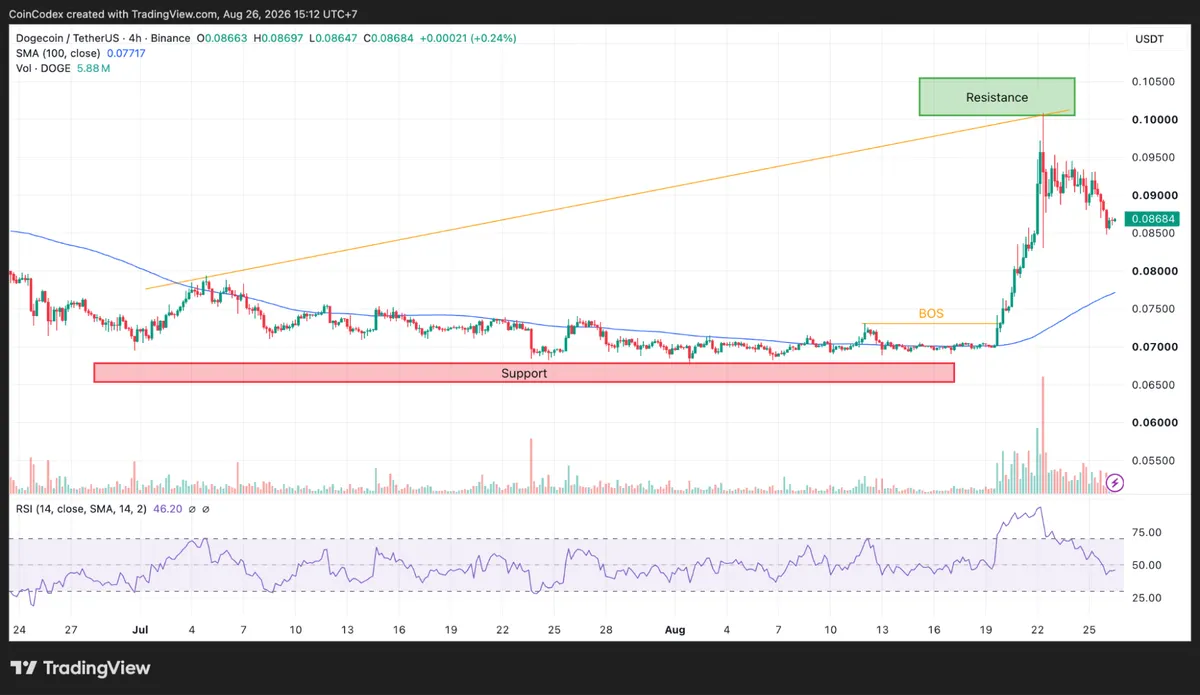
4-hour DOGE chart analysis
Then in mid-August, DOGE printed a Break of Structure, basically a signal that the old downtrend was done. After that, it ran toward $0.10 before hitting a wall. After hitting $0.10, DOGE pulled back to $0.08684. Buyers are trying to hold that level now.
The bigger trend still favors bulls. DOGE is holding above the 100-period SMA on both the 4-hour and daily timeframes. The 4-hour SMA sits at $0.07717, while the daily one is at $0.08041.
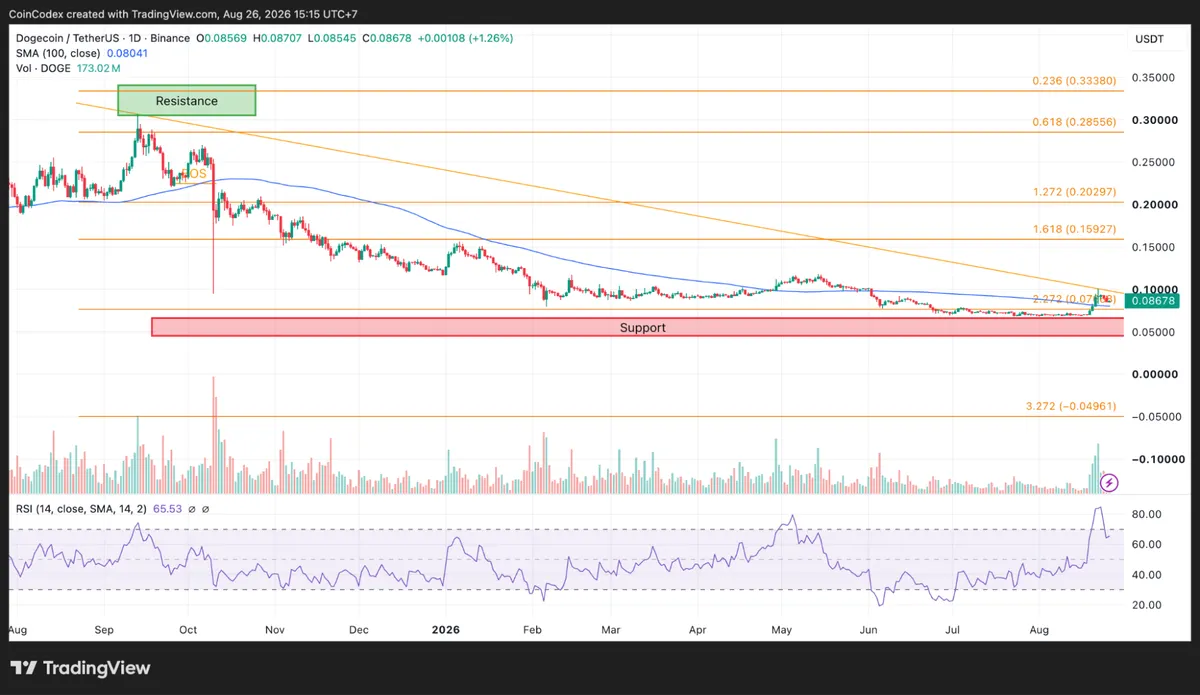
Daily DOGE chart analysis
Momentum is in a decent spot. Daily RSI is at 65.53, bullish but not stretched. The 4-hour RSI cooled down to 46.20 after the rejection at $0.10, giving the market room to reset before the next attempt higher.
Spot DOGE ETF flows are improving
Another factor helping the DOGE price is a change in ETF activity. Data shared by BSCN shows spot DOGE ETFs recorded net inflows of $146,000 on August 24. More importantly, the funds posted inflows during two of the previous three trading sessions.
Spot Dogecoin ETFs see full reversal of fortune.
Until recently, spot $DOGE ETFs have been some of the worst performing in the entire industry. But that could be changing.
After recording +$146,000 in net inflows on August 24, spot $DOGE ETFs have seen inflows on 2 out of the… pic.twitter.com/ytVkYL536g— BSCN (@BSCNews) August 25, 2026
That may not sound huge compared with Bitcoin ETFs, but it marks a noticeable improvement for products that had struggled to attract capital for much of the year. Institutional activity has not been entirely positive, though.
Wu Blockchain reported that CleanCore exited its Dogecoin treasury strategy by selling approximately 463 million DOGE for about $33.4 million. The company redirected the funds toward AI infrastructure investments and later completed a $100 million stock offering.
CleanCore Exits Dogecoin Treasury Strategy With $33.4M DOGE Sale to Fund AI Pivot
According to CryptoSlate, citing SEC filings, CleanCore sold substantially all of its 463 million DOGE holdings on July 20 for about $33.4 million and redirected the proceeds toward its AI… pic.twitter.com/fmtojVdcW6— Wu Blockchain (@WuBlockchain) August 24, 2026
Despite that large sale, the DOGE price continued moving higher afterward, showing that demand was strong enough to absorb the additional supply.
Dogecoin on-chain data supports the rally
One of DOGE's biggest strengths right now is network activity. Glassnode data shows active addresses jumped from about 36,200 during the consolidation phase to nearly 43,000 when the breakout happened. That's real growth in user participation, not just price movement.
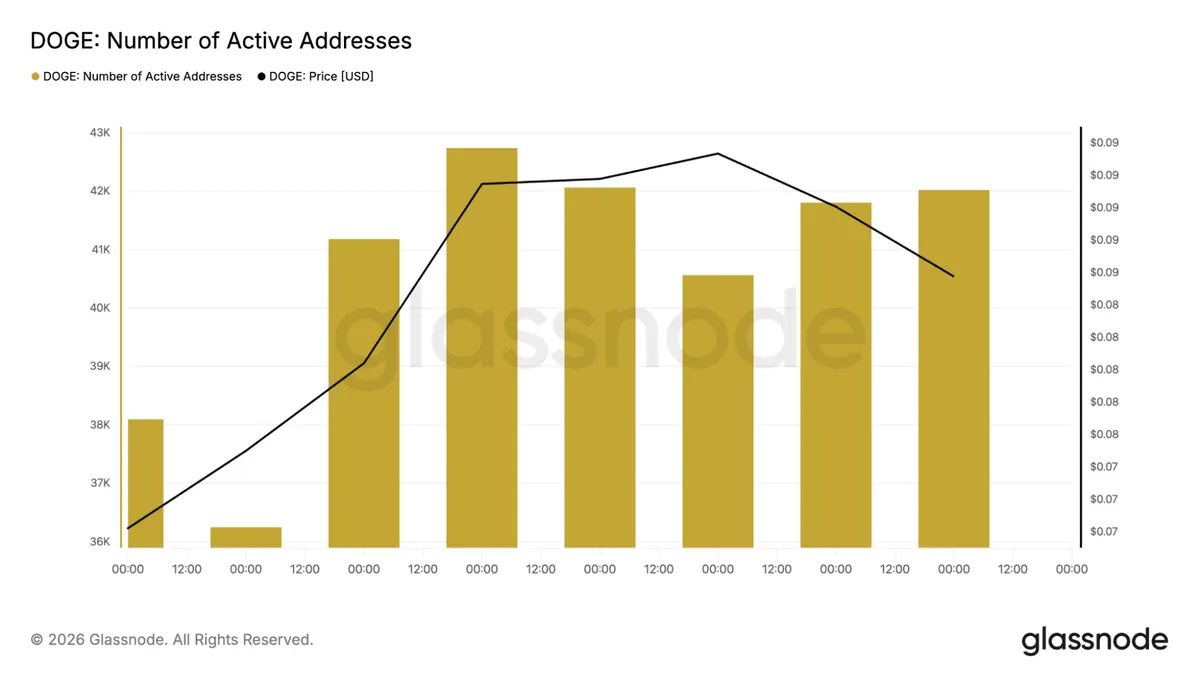
Even after the price cooled off from the local highs, active addresses stayed elevated around 42,000. That matters, healthy rallies tend to have sustained user participation, not just a one-off spike.
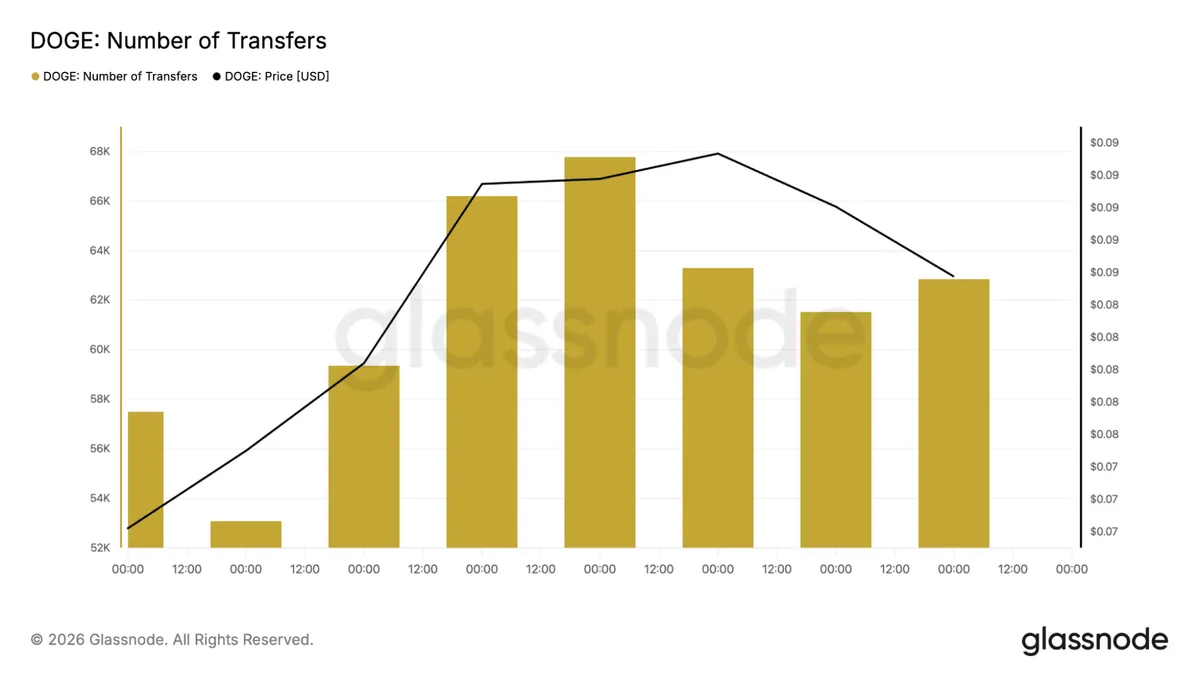
Transaction activity also climbed. Daily transfers went from about 53,000 to a peak near 68,000 before settling around 62,800. The bottom line: network usage is still well above where it was before the breakout. That's a good sign. In other words, activity did not disappear when the DOGE price paused near resistance.
Can the DOGE price reach $0.15?
The next obstacle remains the $0.10 level. DOGE already tested that $0.10 area and got rejected. That $0.10 level is the big one. If buyers can push through, the next stop is $0.15, which lines up with the 1.618 Fibonacci level at $0.15927.
On the downside, support is clustered between $0.083 and $0.0868. As long as DOGE holds that zone, the breakout is still valid. If it breaks below, then we're talking about a different story. The bigger picture is interesting because a few things are lining up at once.
The DOGE/BTC ratio is testing a historical support zone. DOGE itself broke a year-long downtrend. ETF flows are picking up. And network activity is strong. For now, bulls need to defend support and get back above $0.10.
According to CoinCodex’s 1-month DOGE price prediction, the price is projected to reach around $0.09180, which is slightly above the current trading range near $0.086-$0.087 and would place the DOGE price back within reach of the key $0.10 level.









