


Key highlights:
- The SUI price has broken above a year-long descending trendline and reclaimed the 100-day SMA at $0.7711
- SUI’s market cap climbed from $2.7 billion to $3.45 billion as the price moved toward $0.84
- The $0.8936 resistance level could determine whether SUI makes a move toward the $1 mark
SUI has finally given bulls something to work with. After months of trading near the bottom of a brutal decline, the SUI price has pushed back above $0.80 and broken a descending trendline that had kept sellers in control for more than a year. The move also came with a major increase in market capitalization, giving the rally more weight than a simple low-volume bounce.
But there is still a lot to prove. Sui's TVL has fallen heavily from its 2025 peak, and Phantom is preparing to end SUI support in September. So, is this the start of a bigger recovery, or is SUI heading into another rejection?
SUI price finally breaks above a major trendline
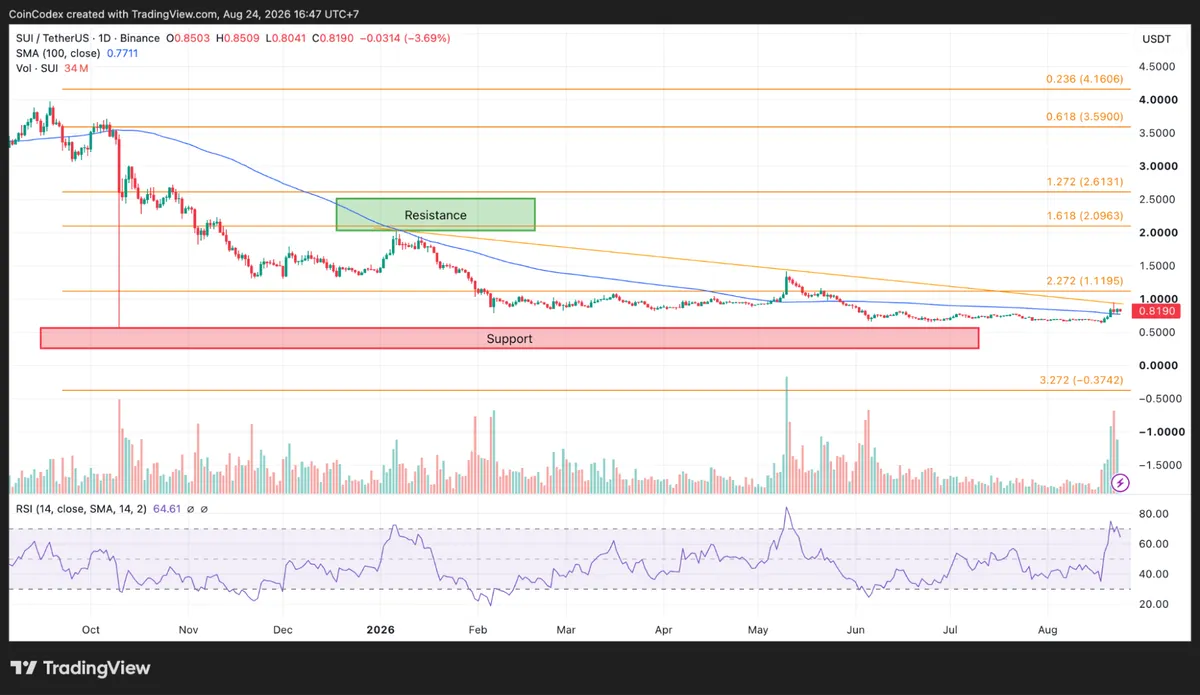
We had a look at the SUI chart, and the daily setup is quite interesting. SUI collapsed from around $3.50 between October and December 2025, eventually finding support near $0.50. From there, the token spent roughly eight months moving sideways between $0.50 and $1.10.
Daily SUI chart analysis
That long period at the bottom gave buyers plenty of time to defend the $0.50-$0.70 area. Every major test of the zone attracted buyers, and the price never managed to establish a lasting break below it. Now, the SUI price has broken above the descending trendline connecting several lower highs from 2026. It has also reclaimed the 100-day SMA at $0.7711.
That matters because SUI has spent much of the year below this moving average. Holding above it could give the recovery a stronger foundation. The next obstacle is $0.8936, the 1.0 Fibonacci extension. A daily close above that level would put $1 firmly within reach, with $1.10-$1.20 becoming the next major area to watch.
SUI has added around $750 million in market value
The price chart looks bullish, but the market-cap data makes the move even more interesting. SUI's market cap climbed from approximately $2.7 billion when the token traded around $0.66 to about $3.45 billion as the price moved toward $0.84.
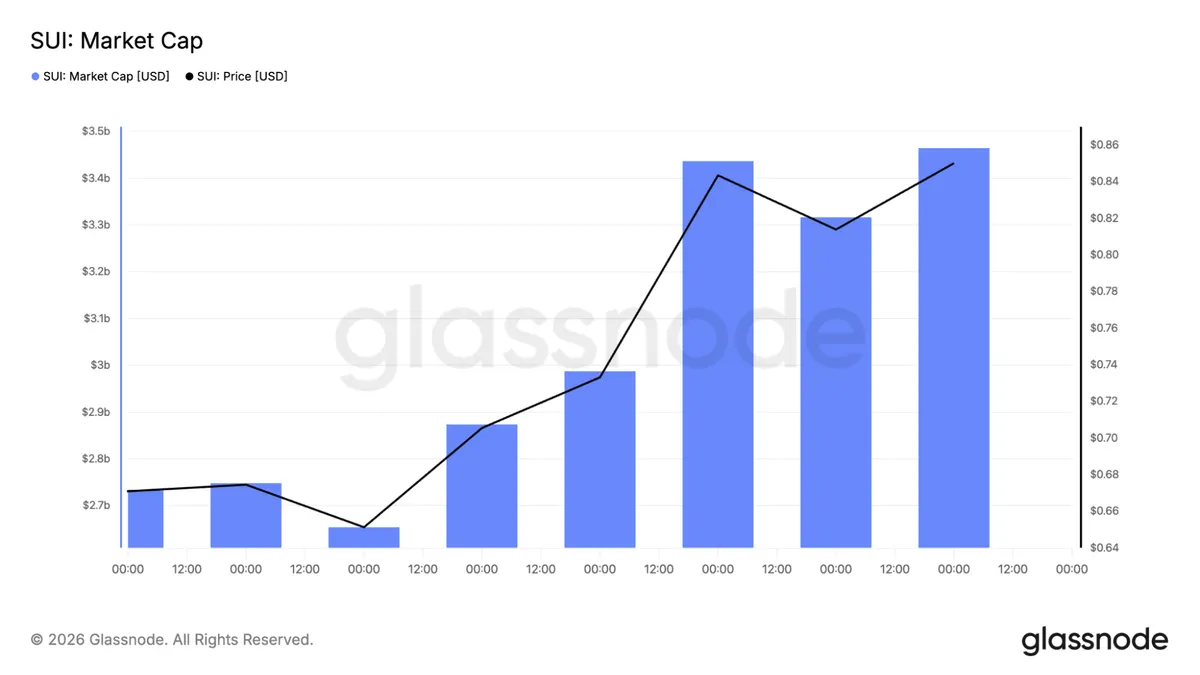
That is roughly $750 million in additional market value in only a few days. The market cap did experience some profit-taking along the way, dropping from around $3.4 billion to $3.3 billion before recovering to approximately $3.45 billion.
For the SUI price, that recovery is encouraging because it shows that the capital entering the market has not simply disappeared after the first wave of buying. There is also plenty of room between the present price and SUI's previous all-time high.
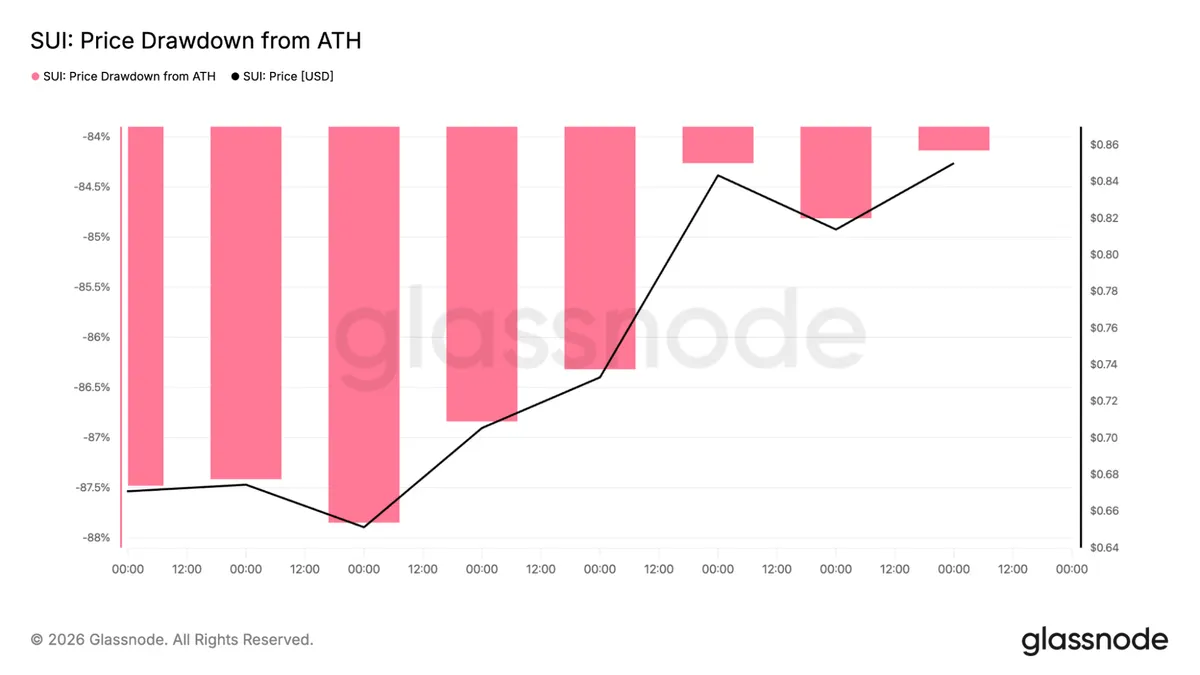
The token remains around 84% below that peak. From approximately $0.84, SUI would need more than 600% upside to fully recover to its former high.
SUI price: why $0.735 is an important level
Crypto analyst Michaël van de Poppe has identified $0.735 as an important area for SUI. His view is straightforward: if that level holds and Bitcoin turns higher, SUI could start challenging its previous highs. The charts provide several levels traders can watch around this idea.
For sure, the most optimal entry for $SUI is at $0.735.
However, this is an important level to look for entries.
If this holds, and #Bitcoin curls back up, I think that we'll start attacking the highs the coming days for $SUI. pic.twitter.com/WaJcTrm5qv— Michaël van de Poppe (@CryptoMichNL) August 23, 2026
The SUI price climbed from roughly $0.70 to almost $0.95 before falling back toward $0.82. On the 4-hour timeframe, $0.848 is the first resistance, followed by the $0.95 local high. Below the market, $0.705 is the key support.
If that level fails, the $0.64-$0.682 area becomes important because it lines up with the previous consolidation range and moving-average support. In other words, SUI does not need to immediately return to $0.95 for the bullish setup to remain alive. Holding the breakout structure may be more important than chasing another vertical move.
Sui's weak TVL is the main concern
There is one part of the story bulls cannot ignore. The highly popular Phantom wallet will end SUI support on September 24, 2026. Users will need to move their SUI to another compatible wallet or swap it into a supported asset before the deadline.
Meanwhile, Sui's TVL has dropped from about $2.58 billion in October 2025 to roughly $469 million now, which is an 82% decline.
So here's the contrast, SUI price is bouncing back from a deep hole, but the network itself has way less capital locked in than it used to. That doesn't mean the price recovery is fake. But it does mean the rally can't survive on technicals alone. It needs some real fundamentals to back it up if it's going to stick.
Can the SUI price reach $1?
Yes, $1 is becoming a realistic technical target, but SUI still has to clear a few hurdles first. The first is $0.8936. Breaking that level would put the SUI price within striking distance of the psychological $1 mark. From $0.819, reaching $1 would require roughly 22% upside.
At $1, SUI's market cap would be around $4.2 billion based on the figures in the on-chain data. That would require roughly another $750 million in market value from the latest $3.45 billion level.
The key support is $0.80, followed by the 100-day SMA at $0.7711. If SUI holds those levels, the bullish structure remains intact. A decisive daily close below $0.7711 would tell a very different story, potentially sending the SUI price back toward $0.70.
According to CoinCodex’s 1-month SUI price prediction, the price is projected to reach around $0.6178, which is below the current trading area near $0.82.









