


Key highlights:
- The ADA price is holding key support near $0.1867 as bulls target higher resistance levels
- Cardano’s upcoming upgrades and ETF prospects remain important catalysts
- Technical indicators are improving, but the ADA price remains far below its all-time high
Cardano is trying to find its footing. After months of getting hammered, ADA is hanging around $0.1867. It's still a long way from its old highs, no question about that. But traders are watching this level closely. Everyone's wondering if this spot can finally hold and give ADA a chance to bounce back.
Crypto analyst More Crypto Online noted that ADA is respecting important support and resistance levels, putting the focus on whether buyers can push the price above nearby resistance. Beyond the charts, Cardano is also moving through an important period that includes major network upgrades and growing ETF discussions.
Cardano is holding an important support level
Cardano trading above the $0.186712 level on More Crypto’s chart. That makes it one of the most important zones to watch in the short term. If buyers continue defending it, ADA could attempt a move toward higher Fibonacci resistance levels. If it breaks, the next major support sits much lower at $0.173288.
$ADA is respecting all the levels right now. Let´s see if the bulls can take the price above resistance. pic.twitter.com/IpydBjanKv
— More Crypto Online (@Morecryptoonl) August 20, 2026
The broader trend is still bearish on this timeframe. Since peaking near $0.29, ADA has continued printing lower highs and lower lows. The latest decline pushed the Cardano price from the $0.21–$0.22 area down to its present range.
Several resistance levels remain overhead. The first is $0.190587, followed by $0.195411, $0.199856, and $0.202489. Bulls will need to reclaim these zones before the market can start talking about a stronger trend reversal.
The Elliott Wave structure also points to an unfinished correction. The chart maps out a larger A-B-C pattern, with the final leg of that correction still developing. That means the market may need more time before a clear bottom is confirmed.
Cardano's fundamentals are improving, but adoption remains a challenge
One of the biggest is the Dijkstra upgrade cycle. Phase One is expected later in 2026 and introduces Ouroboros Linear Leios, a feature designed to improve network throughput through Endorser Blocks.
Phase Two is targeted for 2027 and focuses on faster transaction finality through Ouroboros Peras. If these upgrades are delivered successfully, Cardano could become more attractive for developers and applications that require higher network performance.
There is also a regulatory catalyst on the horizon. ADA became eligible for a streamlined spot ETF review on August 9, 2026, after satisfying the SEC's six-month CME futures requirement. Grayscale's proposed ADA ETF now faces an October 23 decision deadline.
An ETF approval would open the door to institutional capital. However, approval is not guaranteed, which means traders are still weighing both outcomes. At the same time, Cardano continues to trail larger ecosystems in terms of adoption.
Its DeFi total value locked remains around $70 million, a small figure compared to networks such as Ethereum and Solana. That gap continues to limit the amount of capital flowing into the ecosystem.
ADA on-chain data shows recovery is still a work in progress
On-chain data shows that Cardano still has work to do before a full recovery can take shape. Cardano's market cap dropped from about $7 billion to $6.5 billion in a short stretch. That's a $500 million loss, or roughly 7.1%.
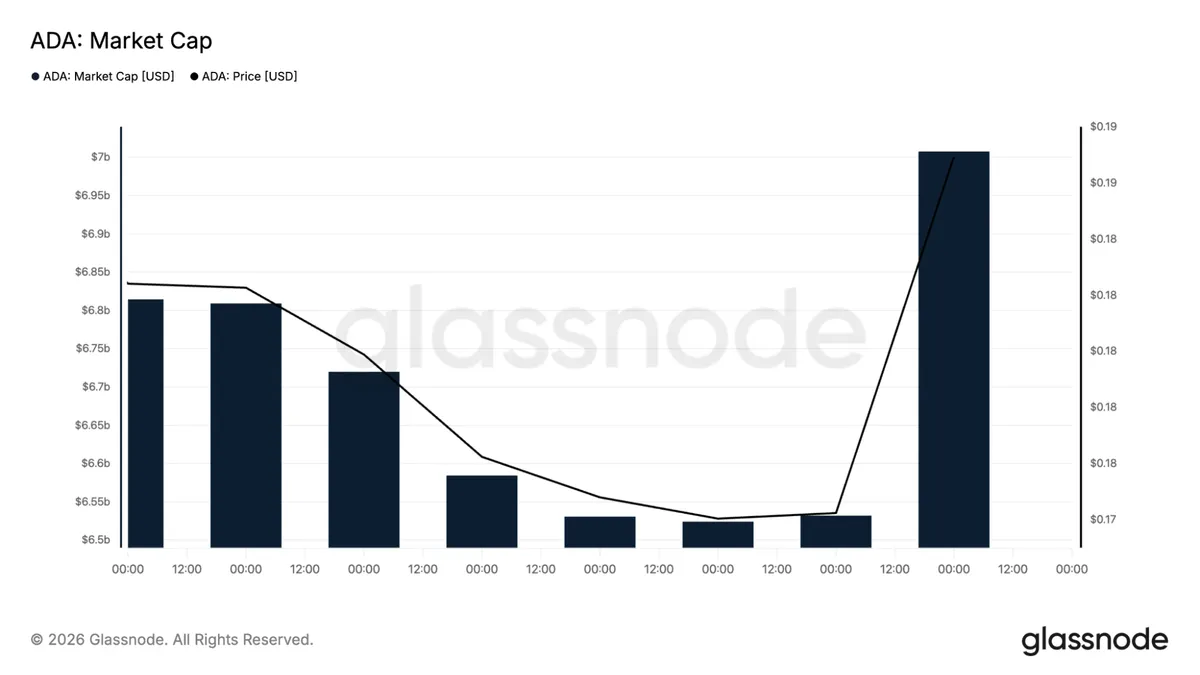
There were a few bounces along the way, but none of them had enough juice to flip the bigger picture. Zoom out, and it gets uglier. ADA is still down about 94% from its September 2021 peak near $3.10.
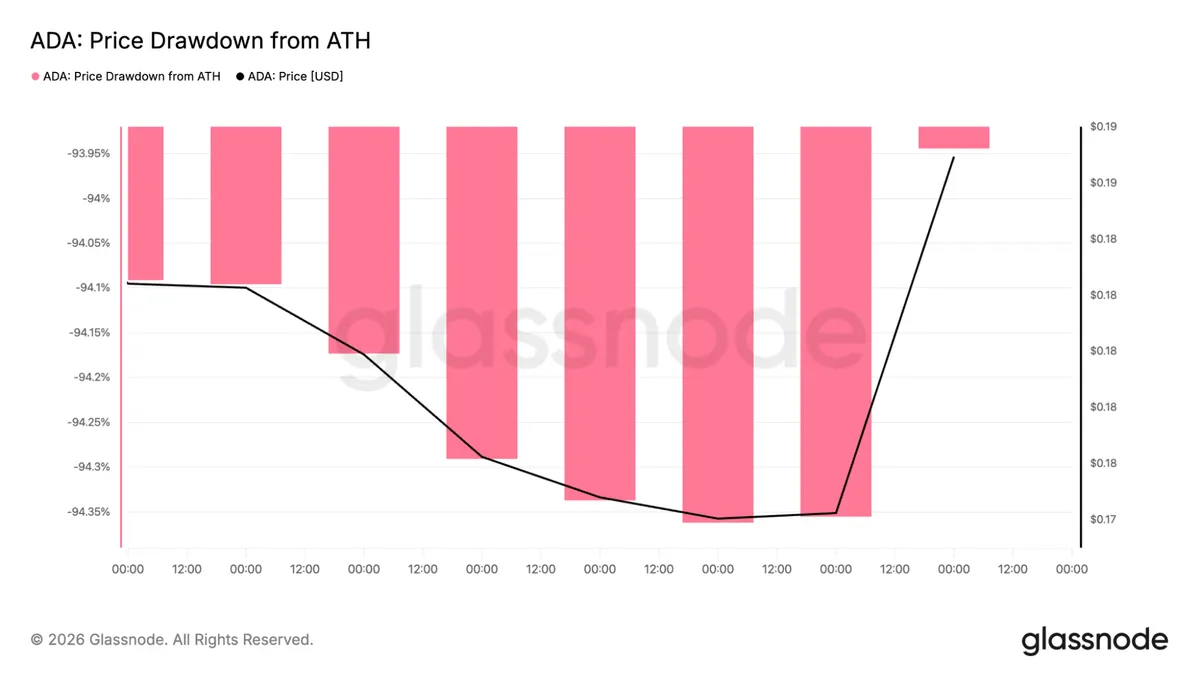
Trading between $0.15 and $0.19 puts it in one of the deepest holes among the big cryptos. The encouraging part is that the drawdown has stopped getting dramatically worse. The market appears to be finding support, even if a clear uptrend has not fully developed.
ADA charts signals are becoming more positive
The daily chart presents a much healthier picture than the earlier corrective structure. The ADA price is trading above its 100-day simple moving average at $0.1863. ADA is changing hands near $0.1906, placing it roughly 2.3% above the moving average.
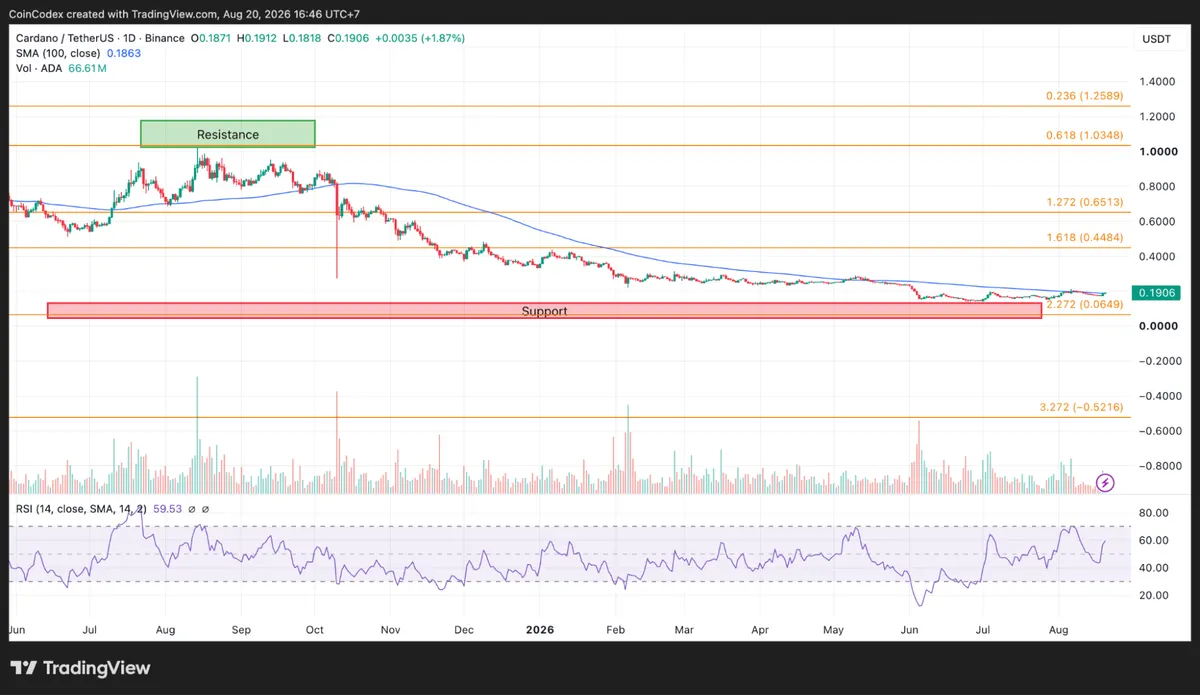
Daily ADA chart analysis
That might not seem like a big deal, but it's the first time in 2026 that ADA has held above the 100-day SMA for any real length of time. Momentum is looking better too. The daily RSI is at 59.53, which is above neutral 50 but still under the 70 overbought line. So buyers are in control, but things haven't gotten crazy yet.
We pulled up a 4-hour chart as well, and the shorter-term picture looks solid. ADA is trading above the 100-period SMA at $0.1872, and that average is tilting upward. That's a good sign for the near-term trend.
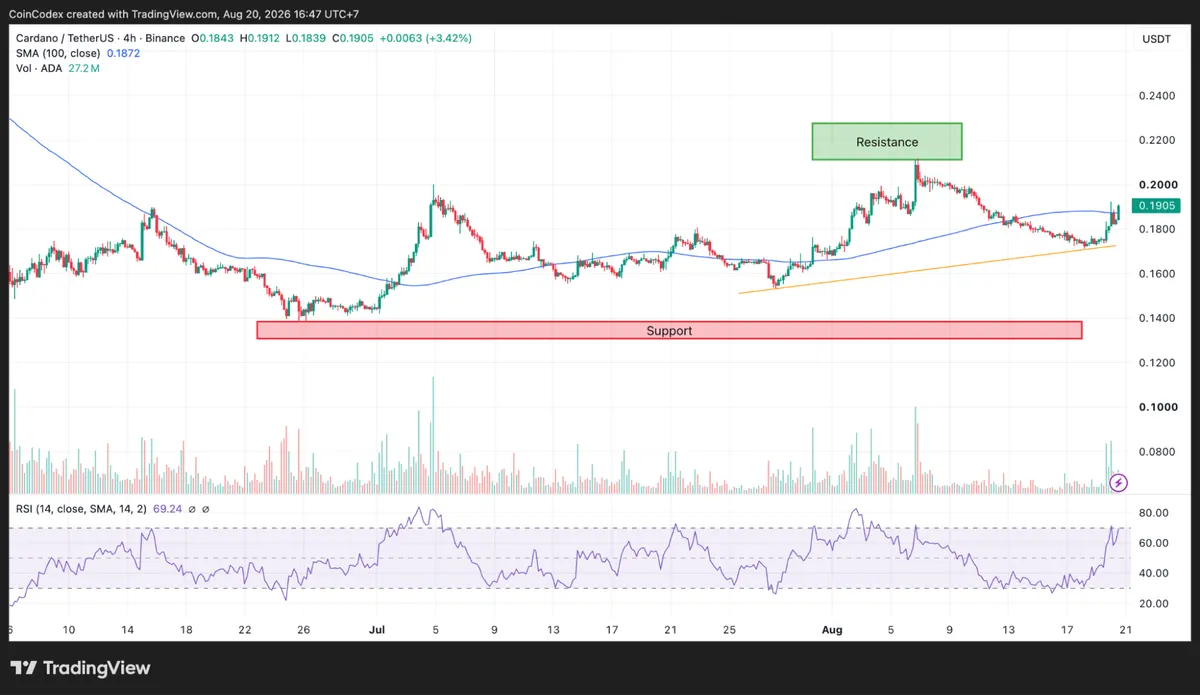
4-hour ADA chart analysis
The RSI on that timeframe is at 69.24, just shy of overbought. So momentum is strong, but if it crosses above 70, we could see a little pause or pullback. The immediate hurdle is $0.1912, which was the high from the latest session. If ADA breaks above that, $0.20 comes into play, then $0.21 and $0.22 after that.
Where could the ADA price go next?
The Cardano price is sitting at an important crossroads. The bearish argument is easy to understand. ADA remains more than 90% below its all-time high, market capitalization has been trending lower, and adoption still trails larger blockchain ecosystems.
The bullish argument is becoming stronger, though. ADA is trading above key moving averages on both the daily and 4-hour charts, momentum indicators are improving, and ETF eligibility provides a potential catalyst later this year.
If buyers can push the Cardano price above $0.190587 and then $0.195411, attention could quickly turn toward $0.202489 and the psychological $0.20 level. According to CoinCodex’s 1-month ADA price prediction, the price is projected to reach around $0.1861.









