



Key highlights:
- The gold price has pulled back from $4,428, with $4,300–$4,200 acting as key support
- Gold-backed ETFs recorded $3.5 billion in weekly inflows, extending the streak to six weeks
- The gold daily chart remains bullish, with gold near $4,348 and RSI at 58.87
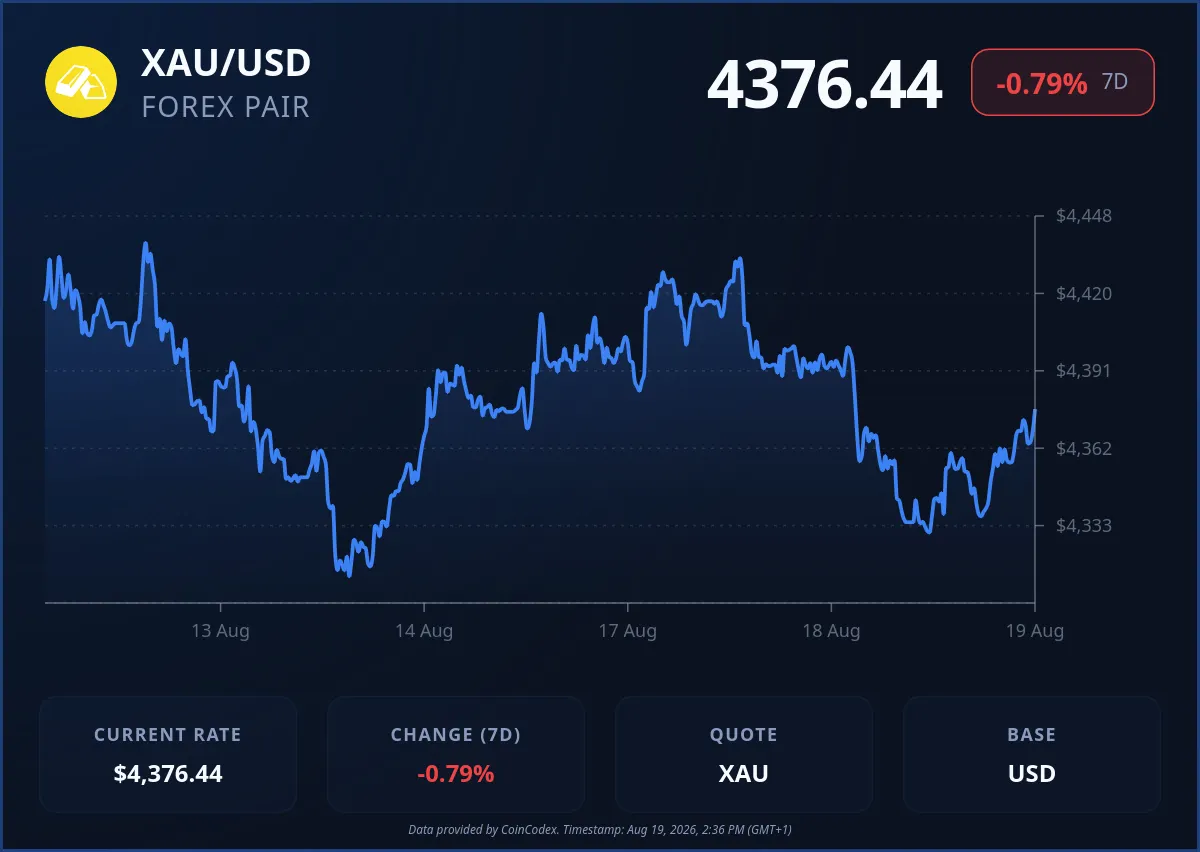
Gold just hit a new high around $4,428, but now it's pulling back a bit. It's down to about $4,341, which is roughly 2% off that peak. So, there's no denying that the short-term momentum has cooled off.
But here's the thing, the bigger uptrend is still intact. This looks more like a pause than a reversal. There's plenty keeping the bulls interested, even with this dip. RSI divergence is raising the possibility of a reversal, gold-backed ETFs are attracting billions of dollars, and the daily chart continues to show a bullish structure.
Gold price pulls back from the $4,428 level
Crypto analyst Rashad Hajiyev believes the current weakness could be shaking out late buyers rather than starting a deeper decline. We had a look at his gold chart, and the short-term correction is clear. Gold ran up to $4,428.89, then dropped back to about $4,341.36. That's an $87 pullback.
Gold's 4-hour RSI suggests that sell-off in gold is engineered to shake out late buyers and not the beginning of a larger decline.
While gold formed a shallow decline, RSI fell lower that gold previous low. Such price action usually suggests imminent reversal... pic.twitter.com/SDRPryHIrW— Rashad Hajiyev (@hajiyev_rashad) August 19, 2026
In the short term, we're seeing lower highs and lower lows. So the immediate trend is kind of stuck in neutral, leaning bearish. The 4-hour RSI confirms it, down to 42.85, which is below 50. That puts sellers in control right now.
But here's the key: gold is still holding above $4,300. That's a big deal. If it breaks below that, the correction gets more serious. The real safety net is the $4,300 to $4,200 zone. As long as buyers defend that area, this is just a dip, not a trend change.
Gold ETF inflows are still very strong
The technical setup is only part of the story. Gold-backed ETF flows are also providing a bullish fundamental backdrop. Data shared by The Kobeissi Letter shows that global physical gold-backed ETFs attracted $3.5 billion in inflows last week. That was the biggest weekly inflow since February 2026.
BREAKING: Global physical gold-backed ETFs posted +$3.5 billion in inflows last week, the largest weekly intake since February 2026.
This also marks the 6th consecutive weekly inflow, the longest streak since January.
Over this 6-week period, ETFs have attracted +$10.0 billion… pic.twitter.com/3qO8dQZpxU— The Kobeissi Letter (@KobeissiLetter) August 18, 2026
It also marked six consecutive weeks of inflows, bringing the total over that period to $10 billion. Those inflows represented approximately 72.2 tons of gold and pushed total ETF holdings to 4,114 tons, the highest level since May.
Europe accounted for $2.3 billion of last week's inflows, North America added $1.1 billion, and Asia contributed another $200 million. The wider data is also notable. Gold ETF flows increased from around $0.5 billion in September 2024 to more than $4 billion around July 2026, during a period when the gold price climbed from roughly $2,500 to above $4,400.
That does not mean gold has to keep rising every day. It does show that institutional demand remains strong enough to support the broader bullish case.
Venezuela's 31 tons of gold are moving to the U.S.
Another development involves Venezuela's gold reserves. The Coin Bureau reported that Venezuela is moving its $4 billion, 31-ton gold reserve from London to a U.S. Treasury account. The reserve had been frozen at the Bank of England since 2018 after the UK refused to recognize Venezuela's government.
🚨BREAKING: Venezuela's $4 BILLION, 31 TON gold reserve is leaving London after EIGHT years, but heading to a US Treasury account instead.
Venezuela's government and opposition struck a rare deal to release the gold from the Bank of England to fund earthquake reconstruction that… pic.twitter.com/lmdnKwT4hP— Coin Bureau (@coinbureau) August 18, 2026
This is more about custody than a fresh source of gold demand. The 31 tons are also relatively small compared with the 4,114 tons held through global physical gold-backed ETFs. Still, the move shows how governments continue to treat physical gold as an important reserve asset during periods of financial and political uncertainty.
What the daily and 4-hour gold charts say about the next move
We also had a look at the daily chart, and the bigger picture remains favorable for gold. The gold price is around $4,348, close to the 100-day SMA at $4,381. The chart has also recorded a bullish Break of Structure, meaning the previous bearish pattern has been broken and higher highs and higher lows are developing.
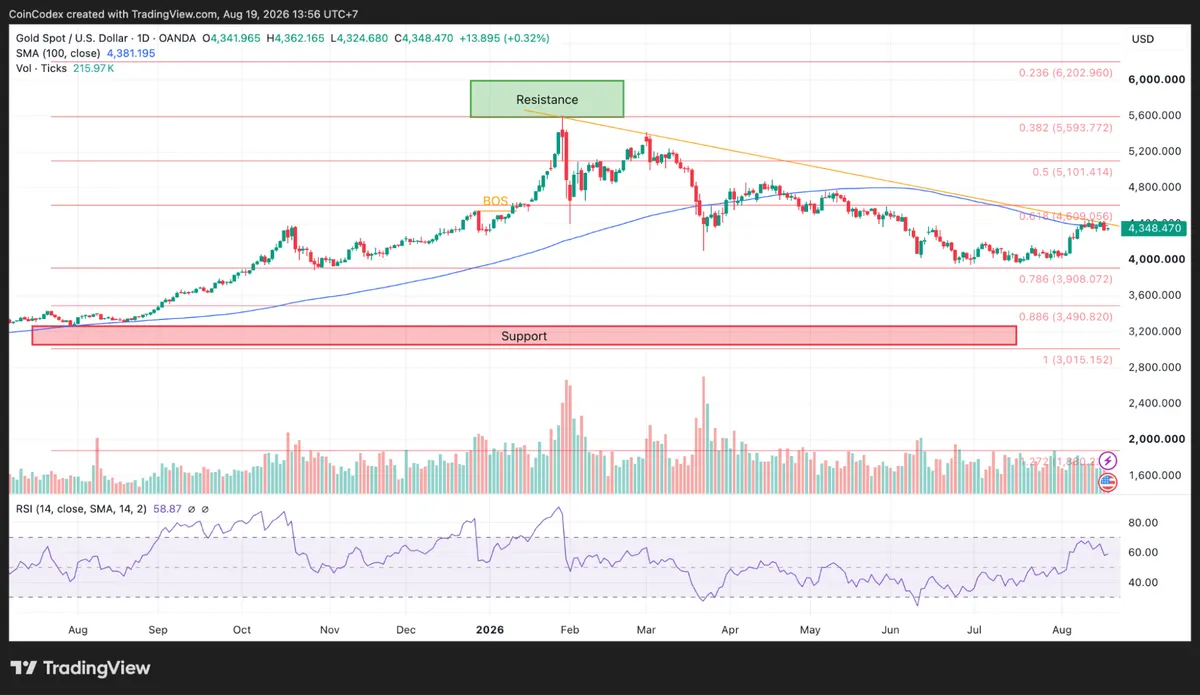
Daily gold chart analysis
The daily RSI is at 58.87. That is comfortably above 50 and still below the 70 overbought threshold. The major Fibonacci support area sits much lower, around $3,900–$3,015. These levels would become relevant if gold suffered a much deeper correction.
Looking further out, the chart points to $5,100 and $5,600 as possible targets if the bigger uptrend stays alive. But zoom in, and things don't look as strong. Gold is trading around $4,347 right now, which is still above the 4-hour 100-SMA at $4,236. That moving average is a key floor for now.
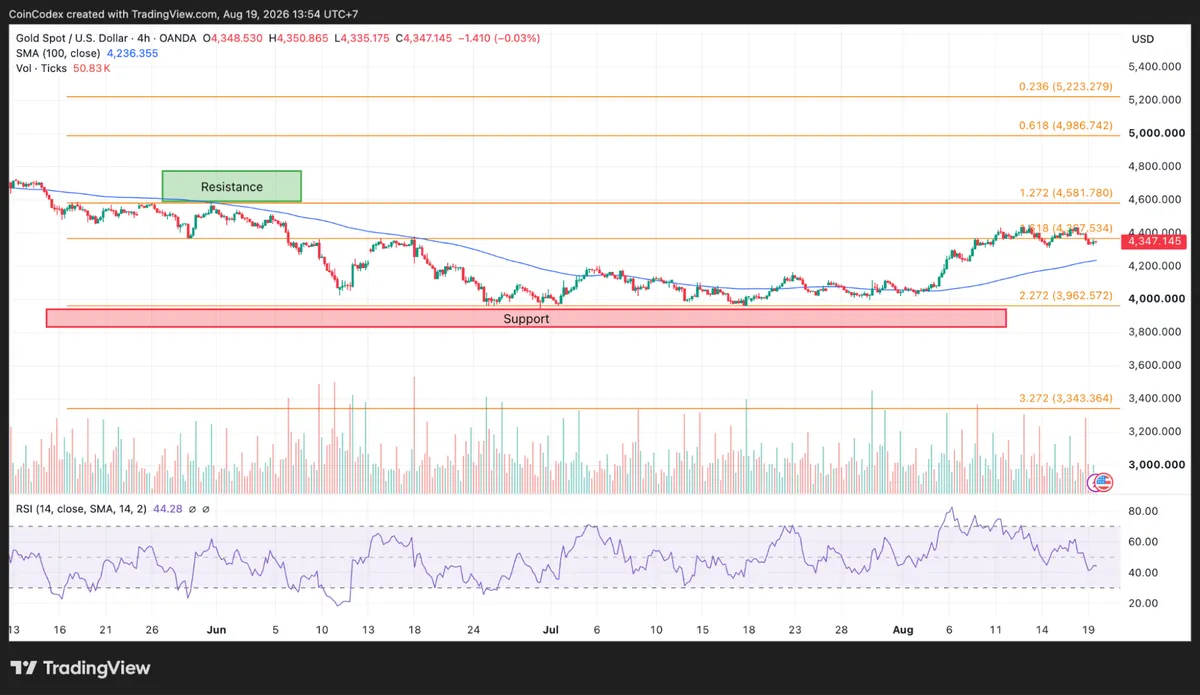
4-hour gold chart analysis
The problem is the 4-hour RSI sits at 44.28, below 50. That tells you sellers are still running the show in the short run. So while the bigger picture might be bullish, the immediate action is weak. Resistance is around $4,581. A move above that level would strengthen the case for another leg higher.
So the two timeframes are giving us different messages. The daily chart remains bullish, but the 4-hour chart needs more work before the next major move can be confirmed.
Can the gold price recover from here?
The first level to watch is $4,300. Holding above it would keep the current correction relatively contained. A move back above $4,385 would improve the short-term picture, with $4,428 becoming the next major hurdle.
If gold breaks above $4,428, the $4,500 area could come into play, followed by the larger targets identified on the daily chart. If $4,300 fails, attention would turn to $4,200 and then $4,100. According to CoinCodex’s 1-month gold price prediction, the price is projected to reach around $4,999.05, which is above the current trading area near $4,340–$4,350.
For now, the data points to a short-term correction inside a broader bullish trend. The gold price is down about 2% from its recent high, but ETF demand remains strong, the daily structure is bullish, and the RSI divergence gives traders a reason to watch for a possible reversal.








