



Key highlights:
- HBAR remains more than 90% below its all-time high, but the $0.062–$0.067 area is showing signs of stabilization
- A break above $0.06768 could strengthen the recovery case, with $0.070–$0.075 and $0.10570 as key levels ahead
- CoinCodex’s 1-month forecast places the HBAR price near $0.09978, pointing to further upside from current levels
Hedera is at an interesting point right now. After falling more than 90% from its all-time high, Hedera is trading close to some of its lowest levels on record. The bigger trend is still bearish, but there are early signs that selling pressure may be easing.
At the same time, there is a macro risk HBAR traders cannot ignore: the Japanese yen. A stronger yen can pressure the carry trade and force leveraged investors to reduce positions across risk assets, including crypto. That means HBAR could face additional pressure even if nothing changes within the Hedera ecosystem.
The HBAR price remains deep in a downtrend
We had a look at the HBAR price across the daily, and 4-hour charts, and the overall trend remains bearish. HBAR is trading around $0.065–$0.067, compared with its all-time high of about $0.94216. That leaves the token roughly 93.8% below its peak.
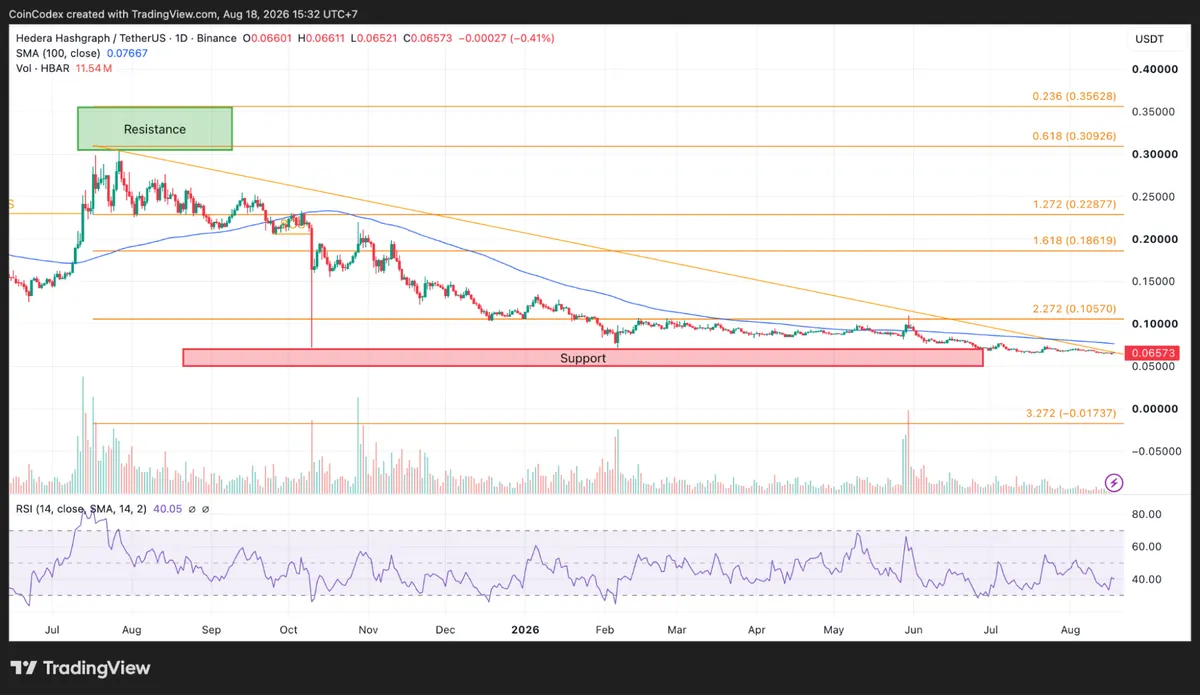
Daily HBAR chart analysis
The daily chart is also firmly bearish. HBAR is around $0.06573, below its 100-day SMA at $0.07667. Its daily RSI is 40.05, which remains below the neutral 50 level. So, sellers still control the bigger timeframe.
The shorter timeframe looks more encouraging. On the 4-hour chart, HBAR is around $0.06581, just below the 100-SMA at $0.06768. The RSI has climbed to 50.34, and price has formed a series of higher lows after finding support near $0.062. That does not confirm a trend reversal yet, but it gives bulls an important level to watch.
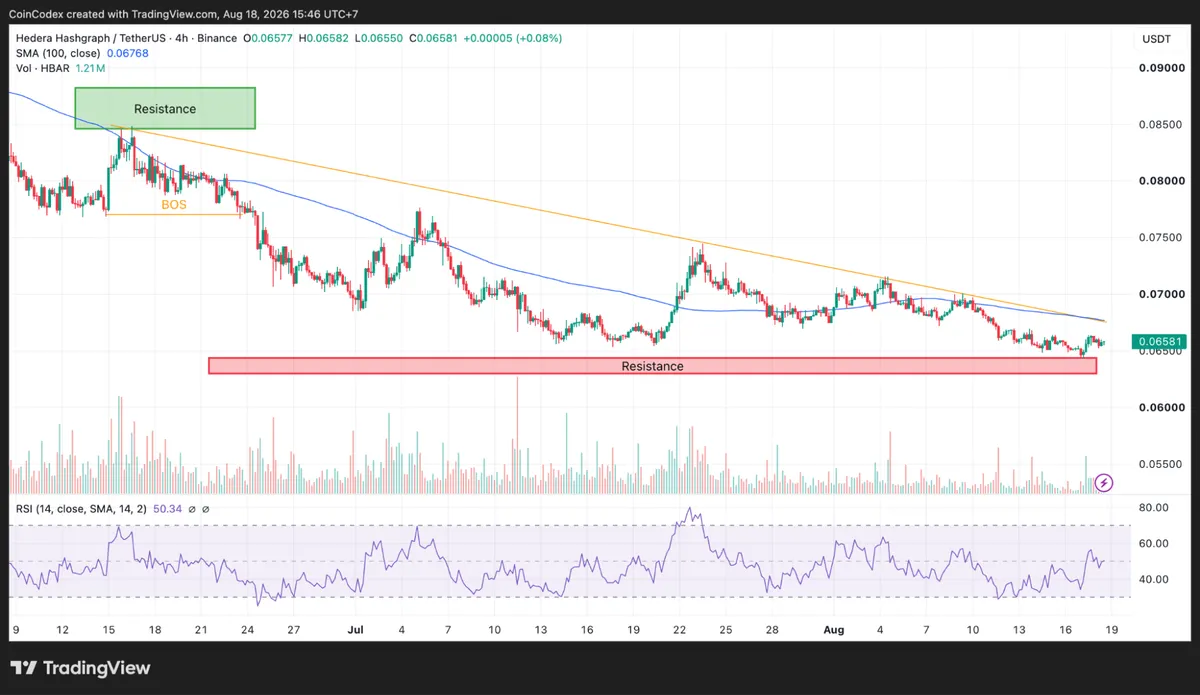
4-hour HBAR chart analysis
The immediate level bulls need to reclaim is $0.06768, which represents the 4-hour 100-SMA. A break above that level with strong volume could open the way toward $0.070–$0.075. The next major daily resistance is $0.10570, based on the 2.272 Fibonacci level. From $0.06573, that would require a gain of roughly 61%.
Above $0.10570, the daily chart identifies $0.18619 as another resistance level. The weekly chart then puts $0.35484 and $0.54174 much higher up the recovery path. HBAR would need to reclaim these levels one at a time. A move toward them becomes more realistic only after the lower resistance zones are cleared.
The HBAR price is near a major demand zone
Crypto Patel's analysis identifies $0.04352–$0.057 as a proven higher-timeframe demand area, with the wider accumulation zone extending down toward $0.026. The historical performance of HBAR around comparable areas is one reason traders are paying attention.
$HBAR Is Not A Chase Here. It’s A Patience Setup.
HBAR Is Down ~84% From Its 2024 High, With Weekly Structure Still Bearish.
But $0.0435–$0.057 Is A Proven HTF Demand Zone That Preceded +1,823%, +816% And +1,600% Expansions.
Watch For: Liquidity Sweep → Reclaim → CHoCH →… pic.twitter.com/GUcx9SnSjb— Crypto Patel (@CryptoPatel) August 17, 2026
Patel points to previous expansions of 1,823%, 816%, and 1,600% from similar demand regions. Of course, previous rallies do not guarantee another move of that size. The important point is that HBAR is approaching a price area where buyers have previously shown interest.
For the bullish setup to become more convincing, Patel wants to see a liquidity sweep, reclaim, change of character and break of structure. Until those conditions appear, the HBAR price remains in a downtrend.
HBAR on-chain data is starting to stabilize
The market-cap data provides another useful clue. HBAR's market cap has been moving between approximately $2.82 billion and $2.96 billion. During the observed period, it declined by roughly 4.7%, from $2.96 billion to $2.82 billion.
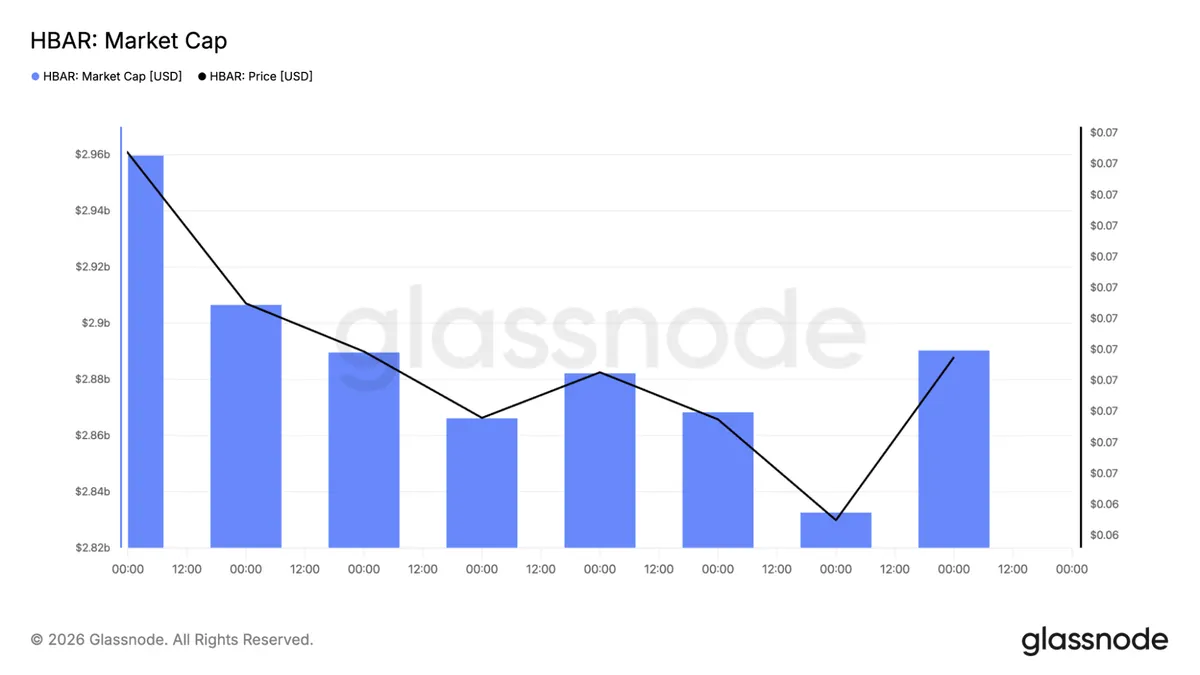
At the same time, the token remained within the $0.065–$0.067 range. That indicates that the market is consolidating around historically depressed levels instead of continuing to accelerate lower.
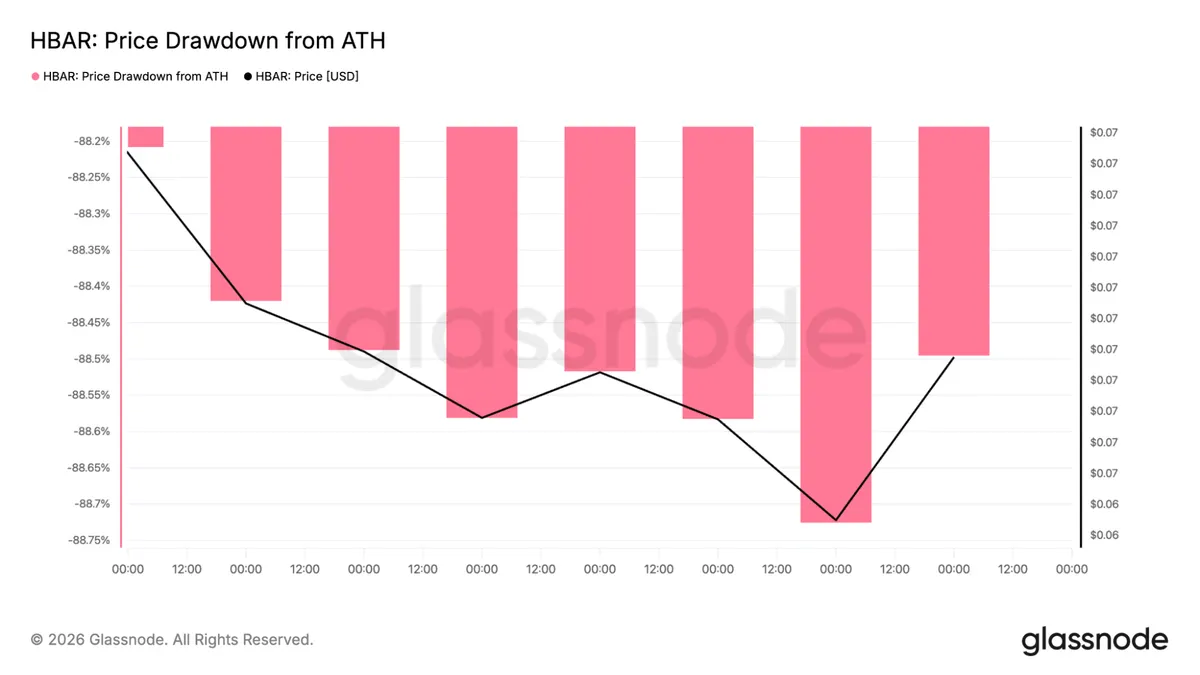
The drawdown is also extreme. HBAR is roughly 88.2%–88.75% below its all-time high based on the supplied market-cap and drawdown data. That does not automatically mean a bottom is confirmed. Extreme drawdowns can persist for long periods. But if selling pressure continues to weaken, these levels could become important for accumulation.
Why the Japanese Yen matters for HBAR
Cheeky Crypto's analysis introduces a risk that has little to do with Hedera itself. The concern is the yen carry trade. Investors can borrow or obtain funding in yen and deploy that capital into higher-return assets. If the yen strengthens, those trades become less attractive and leveraged investors may need to reduce exposure.
Japan’s Yen Could Trigger an HBAR Liquidity Shock
Japan’s yen could trigger an HBAR liquidity shock without anything changing on the Hedera network itself. This video explains how yen-funded carry trades, changing Bank of Japan expectations, leverage and global liquidity can… pic.twitter.com/IIIIOcTf0A— Cheeky Crypto (@CheekyCrypto) August 17, 2026
That can create selling pressure across risk markets. For HBAR, the risk is greater because it is much smaller and less liquid than Bitcoin. During periods of forced deleveraging, investors may sell altcoins aggressively as they reduce risk.
Cheeky Crypto recommends watching USD/JPY, Bank of Japan expectations, yen futures positioning, market volatility, equities, Bitcoin and HBAR relative to BTC. The important point is that a stronger yen does not automatically mean the HBAR price must fall. The real concern is whether yen appreciation causes broader deleveraging.
What If the HBAR price falls again?
The bullish setup would weaken if HBAR loses the $0.065–$0.062 support area. A sustained breakdown could send the price toward $0.050, followed by the $0.04352–$0.02600 accumulation zone. And then there is the yen. If yen strength triggers broader deleveraging, the HBAR price could face another wave of selling.
If liquidity conditions remain supportive and HBAR clears its resistance levels, the token could finally begin testing whether its extreme drawdown has created the base for a larger recovery. According to CoinCodex’s 1-month HBAR price prediction, the price is projected to reach around $0.09978, which is above the current trading area near $0.065–$0.067.









