



Key highlights:
- Ethereum's low-volatility phase could be setting the stage for a larger price move
- The ETH price is holding above the 100-period SMA, with $2,068.90-$2,100 as the key resistance zone
- Network activity remains high, but ETF outflows and competition from other Layer-1 networks remain risks
For weeks now, Ethereum has been going nowhere. Just bouncing inside this tight box. Crypto analyst Daan Crypto Trades mentioned that this kind of flat action for over a month is weird. Usually, something this quiet doesn’t last forever.
The price is at $1,892 right now. That’s barely above the 100-period average at $1,886. The RSI is at 54.56, which is neutral but favors buyers just a little. But here’s the thing. None of that really matters until ETH breaks $2,068–$2,100. That’s the real line in the sand. Until that happens, this is still just a sideways market, not a comeback.
Ethereum price is starting to look stronger
We had a look at the ETH chart shared by Daan, and the price structure has improved after the market dropped from above $2,100 to around $1,550.50. Ethereum has since recovered toward $1,900 and started to form a more stable pattern.
$ETH Volatility completely died off.
Big move coming soon here I assume. Very rarely you see ETH not moving for days after already trading sideways for over a month and not see a big move follow afterwards. pic.twitter.com/umZE87X1Ow— Daan Crypto Trades (@DaanCrypto) August 16, 2026
The move above the 100-period SMA is one of the more encouraging developments. The indicator is at $1,886.30, leaving the ETH price slightly above it at $1,892.77. Holding above this level would give buyers an important technical base.
The RSI also supports the recovery. The RSI is at 54.56. That's above the halfway mark of 50, but it's nowhere near 70, which is the zone where things get overheated. So there's still plenty of room for price to run before it hits that ceiling.
Zoom out to the daily picture. Same kind of setup. ETH is holding above the 100-period moving average at $1,866.88. The daily RSI is at 53.19, almost identical. The chart also broke a structure near the lows, that often signals that buyers might be accumulating after a long drop.
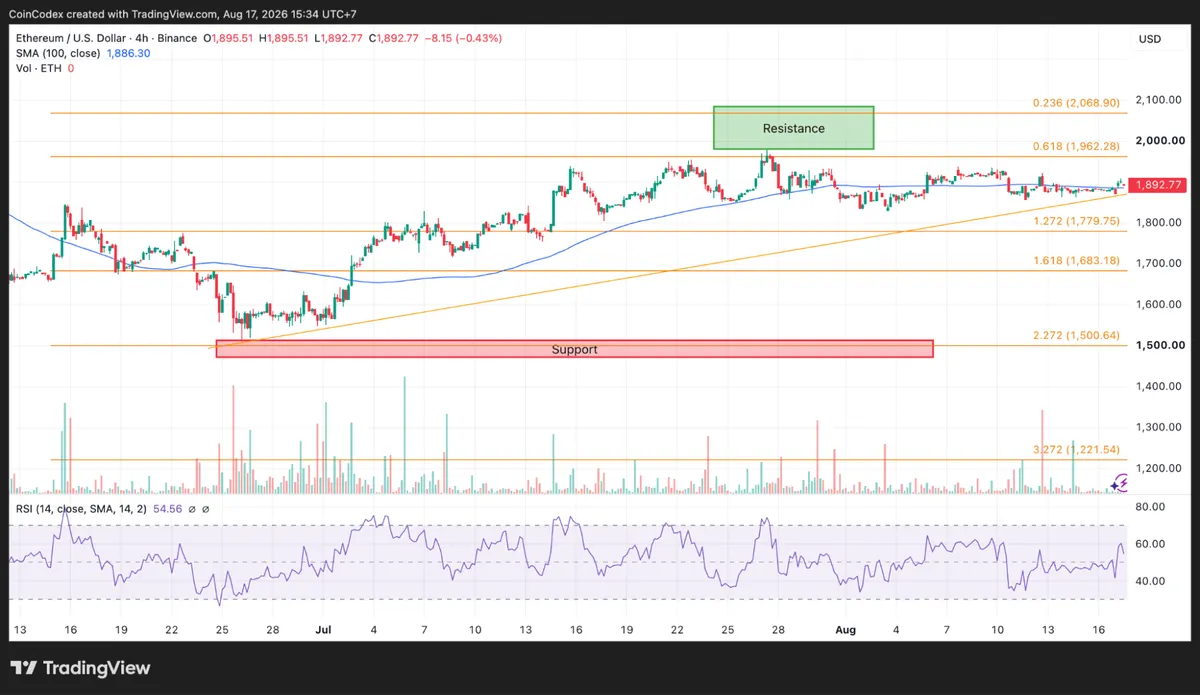
For ETH, $1,930 is the first resistance to watch. Above that, $2,068.90 becomes the bigger test because it lines up with the 0.236 Fibonacci retracement on the 4-hour chart. A move above $2,068.90 would bring the $2,100 psychological level into play. A daily close above $2,068.90 would provide stronger confirmation that Ethereum is moving beyond its recovery phase.
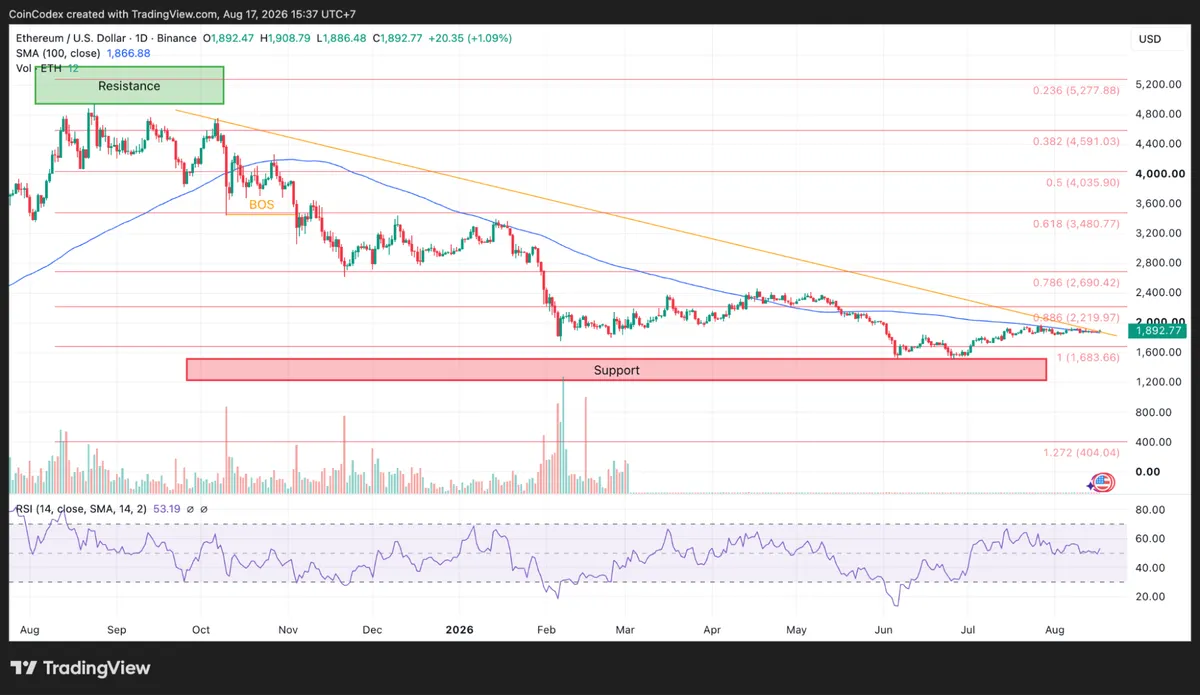
If buyers clear $2,100, the next major target from the daily Fibonacci structure is $2,219.97. Further upside could bring $2,400 and $2,690.42 into consideration. On the support side, $1,872.77 is the first level bulls need to defend. Losing it would weaken the current setup and increase the risk of a move toward $1,800 and lower support areas.
Ethereum network activity remains strong
The recovery in the ETH price is also taking place alongside substantial network activity. On-chain data shows that active addresses reached roughly 860,000 over a 24-hour period before settling around 460,000.
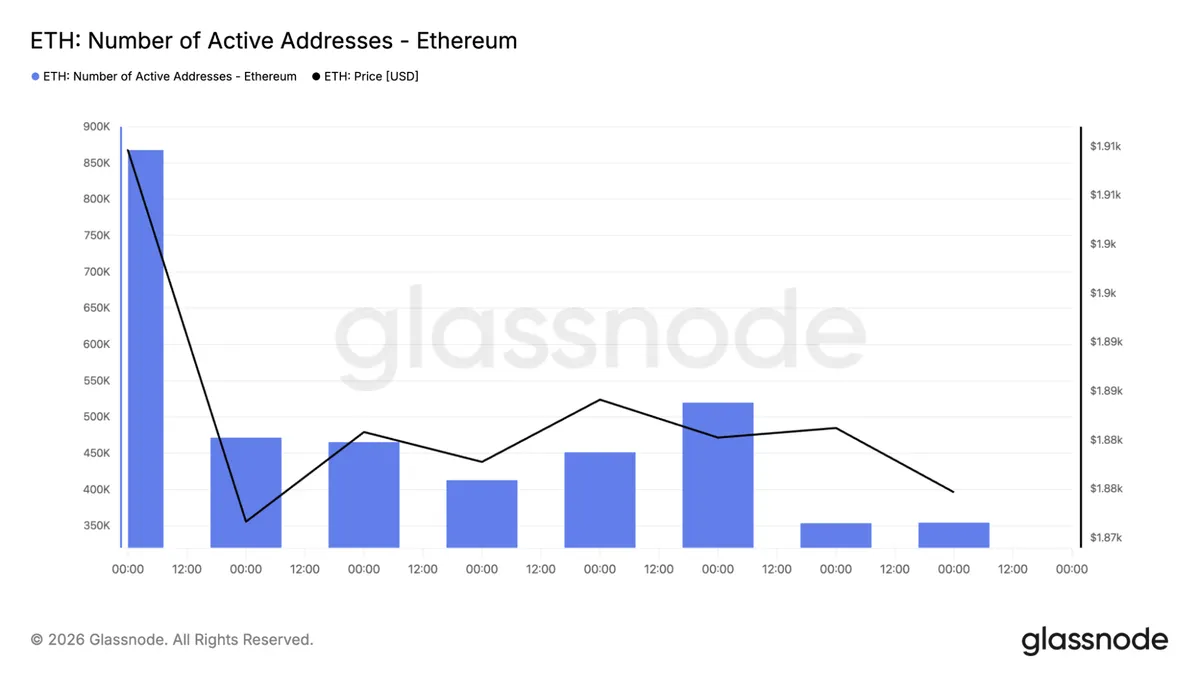
That means Ethereum continues to have hundreds of thousands of wallets interacting with the network each day, even with ETH trading near $1,900. Transaction activity remains high as well. Ethereum processed around 2.9 million transactions at its peak in the observed data, before the figure declined toward 1.7 million.
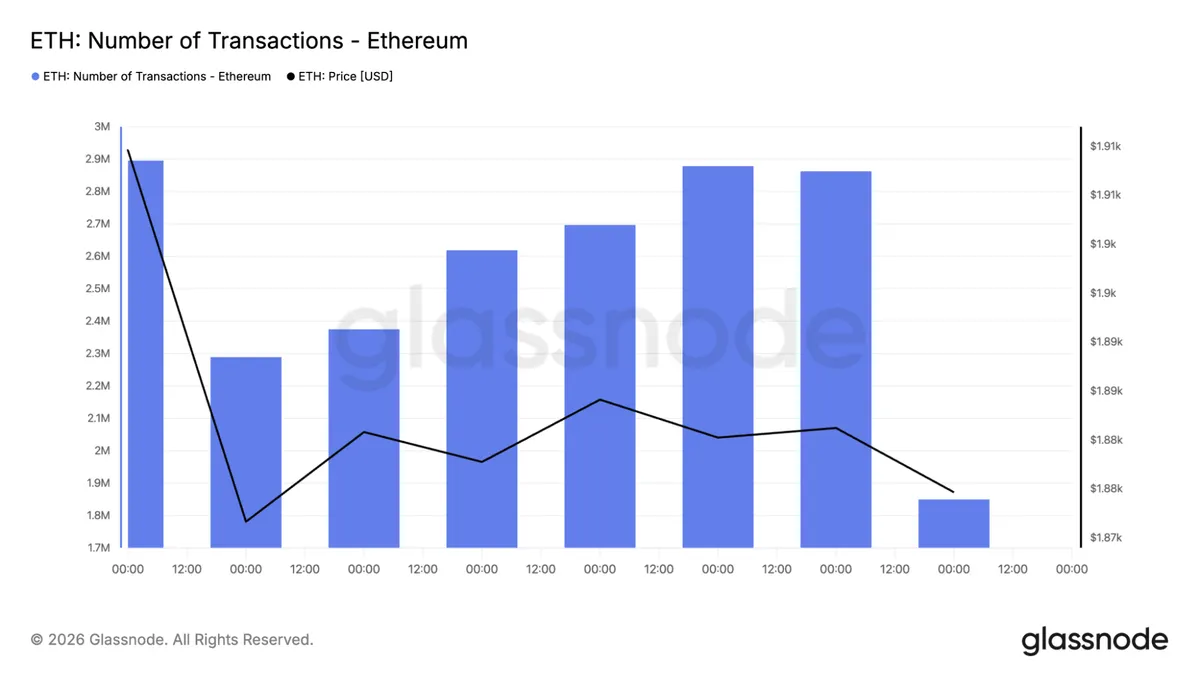
The decline needs some context. Layer-2 networks such as Arbitrum, Optimism and Base handle large amounts of activity outside Ethereum's main chain. As more transactions move to these networks, Ethereum's Layer-1 transaction count can fall even when the broader Ethereum ecosystem remains active.
ETF flows are still a concern
There are also some factors working against the ETH price. U.S. spot Ethereum ETFs recorded $2.26 million in net outflows for the week ending August 14, 2026. This came after stronger inflows in the previous week and contrasted with positive ETF flows for Solana and XRP.
If Ethereum ETF outflows continue, institutional selling could make it harder for ETH to break through the $2,068.90-$2,100 resistance zone. Regulation provides a more positive backdrop. SEC Chair Paul Atkins has stated that ETH is not a security, which removes one major regulatory concern for institutions.
Ethereum also has a development catalyst ahead. The Hegotá upgrade, targeted for 2027, includes plans involving censorship resistance, faster slot times, native account abstraction and Layer-1 scaling. If those upgrades are delivered successfully, they could improve Ethereum's performance and support greater network usage.
Competition remains a challenge, though. Solana and other Layer-1 networks continue to compete for users, developers and transaction activity. Ethereum also faces security and usability concerns, with a study identifying $574.8 million in losses linked to address misuse across Ethereum and BNB Chain.
Where could the ETH price go next?
Daan Crypto’s observation about Ethereum's unusually low volatility is worth watching because extended periods of sideways trading can eventually end with a larger directional move.
The bullish case becomes stronger if the ETH price holds above $1,872.77 and breaks through $1,930. A move above $2,068.90 would provide much stronger confirmation, with $2,100 and $2,219.97 becoming the next upside levels.
The bearish setup would develop if Ethereum loses $1,872.77 and then breaks below the larger $1,683.66 support. That could expose $1,500.64 and potentially $1,221.54. According to CoinCodex’s 3-month ZEC price prediction, the price is projected to reach around $1,957.32, which would be well above the current trading area near $510-$515.









