


Key highlights:
- The LINK price is testing the key $8.50-$8.52 resistance zone after reclaiming support near $8.30
- Glassnode data shows active addresses and transfer activity rebounding, pointing to improving network participation
- Traders are watching for a breakout toward $9.50, with the broader tokenization narrative supporting long-term interest
If you’ve been watching the LINK price action lately, you’ve probably noticed that it has drifted back into a zone that long-term investors keep talking about. LINK is trading around $8.45, and that level matters because it sits almost exactly where CryptoPatel has defined his accumulation area between $5 and $8.
What makes this setup more interesting is that the technical picture and the institutional narrative are starting to point in the same direction. Standard Chartered is reportedly modeling a much larger move for Chainlink over the next several years, with a $200 target by 2030 tied to growth in tokenized assets. Whether that target is realistic is a separate question, but it has definitely pushed the LINK price back onto traders’ radar.
Why institutions are paying attention to Chainlink
The big story here is tokenization. As per the research note published by Standard Chartered Bank, the tokenized asset market is expected to expand from approximately $340 billion at present to around $4 trillion by 2028. The market research also states that up to $2.7 trillion worth of tokenized and native crypto assets would be used in DeFi by 2030.
🚨The Standard Chartered Chainlink note appears to have leaked!
The document reportedly forecasts $LINK at $200 by 2030, arguing Chainlink could become critical infrastructure for a $4T tokenised asset market.
We still can’t verify the original PDF, so treat it cautiously, but… pic.twitter.com/TN8AScoCMF— ALLINCRYPTO (@RealAllinCrypto) August 10, 2026
The logic behind this statement is very simple; tokenized bonds, funds, commodities, and other traditional assets will require price feeds and interoperability. Chainlink already provides much of that infrastructure. The note estimates that Chainlink supports roughly 70% of global DeFi markets and more than 80% of Ethereum-based DeFi markets, with more than $32 trillion in transaction value enabled by Chainlink services to date.
This is the reason why the report considers Chainlink as an infrastructure rather than a speculative token. The projected trajectory is also uniquely detailed, with the LINK token priced at $13 by 2026, $41 by 2027, $62 by 2028, $133 by 2029, and $200 by 2030.
Analysts keep watching the LINK $5-$8 Zone
One part of CryptoPatel’s chart that really caught my attention is the $5-$8 accumulation zone. The LINK price is currently trading between $8.23-$8.45 range and hence is resting at the very top of that range. The rationale for mentioning this range again and again is that it is not just any support level but an important one which is marked as a Bullish Order Block in the chart below.
[TWEET]: https://x.com/CryptoPatel/status/2086748310036238481?s=20
This range also corresponds to a significant Fibonacci retracement range which was previously the bottom for LINK in other previous cycles. The LINK price had topped off at $50 in 2021 before dropping down into the $4-$5 range in the bear market of 2022.
CryptoPatel is looking at this through a multi-year lens. His roadmap starts with a move toward $20-$32, then $50+, and eventually $100+ by 2027. The much larger institutional thesis points to $200 by 2030 if the tokenized-asset market expands toward the $4 trillion level discussed in the Standard Chartered note.
What the 4-hour and daily LINK charts are telling us
We took a closer look at the LINK charts, and the easiest way to think about it is to split the picture into two timeframes. The 4-hour chart shows what traders are doing right now, and the daily chart shows whether the bigger trend is starting to change.
On the 4-hour timeframe, the LINK price has climbed back above its 100-period moving average near $8.30. That is a meaningful change because LINK spent a long time trading below that level.
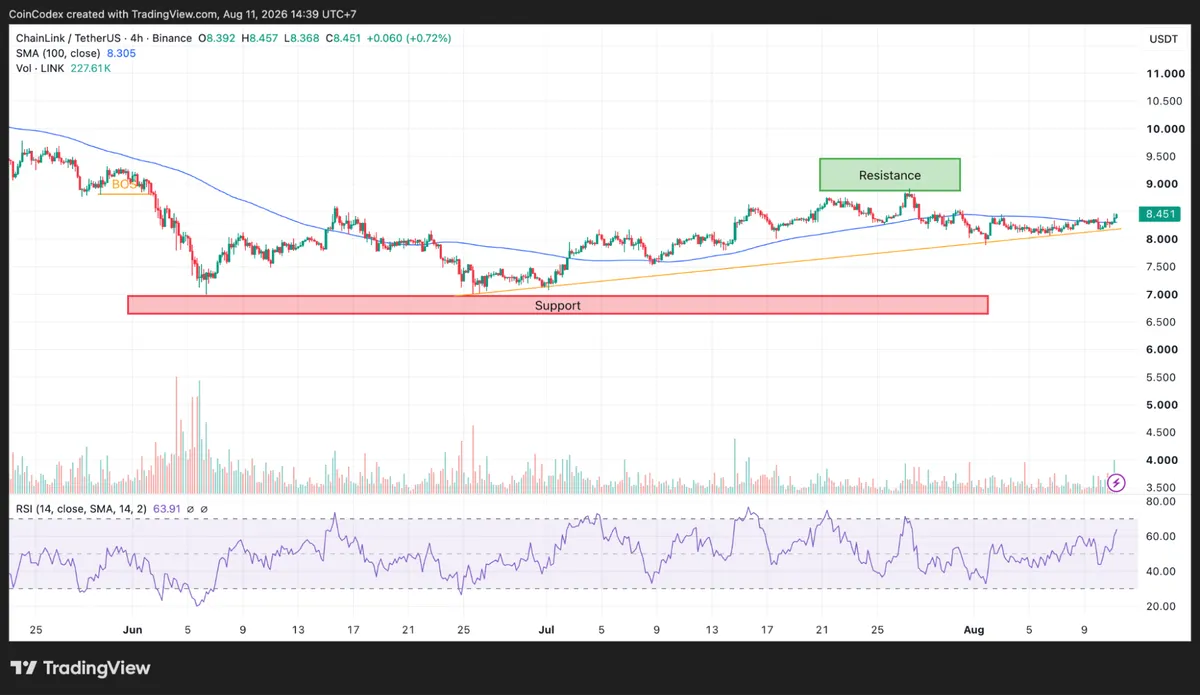
4-hour LINK chart analysis
The market is now testing the $8.50-$8.52 area. Since June, LINK has broken above a previous swing high, printed a clear break of structure, and continued to make higher lows along a rising support line. The 4-hour RSI is around 63.9, which tells me momentum is leaning bullish without looking excessively stretched.
The daily chart is still the more important one for the broader trend. The LINK price is approaching the SMA 100 on a daily basis at $8.52, which has been acting as resistance to the decline for some time now.
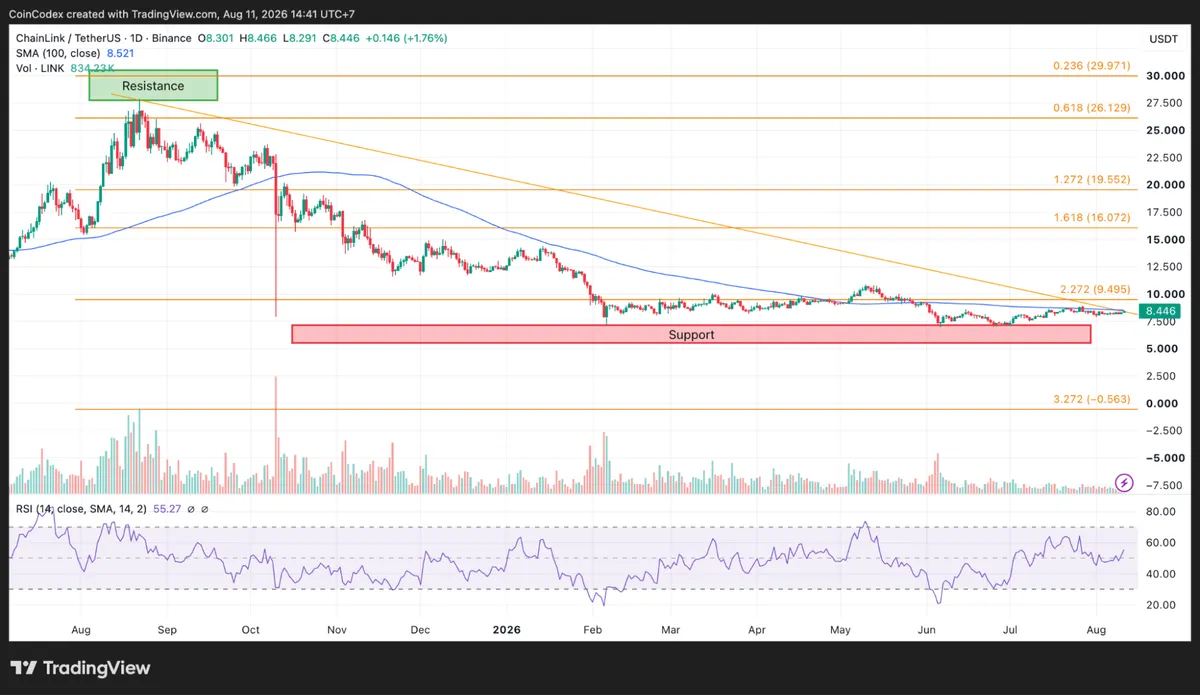
Daily LINK chart analysis
Once traders manage to break past that level, then the next level of significance is $9.50, which has been holding back rallies due to its position as the larger descending trend line for the year. The daily RSI is trading at 55.3, leaving room for further strength in the rally.
The LINK on-chain data is improving again
The network activity has started to recover as well. Glassnode data showed active addresses rising from roughly 3.1K-3.5K to nearly 3.8K before LINK moved toward $8.30. Transfer count climbed from about 6.7K to more than 8.4K over the same period.
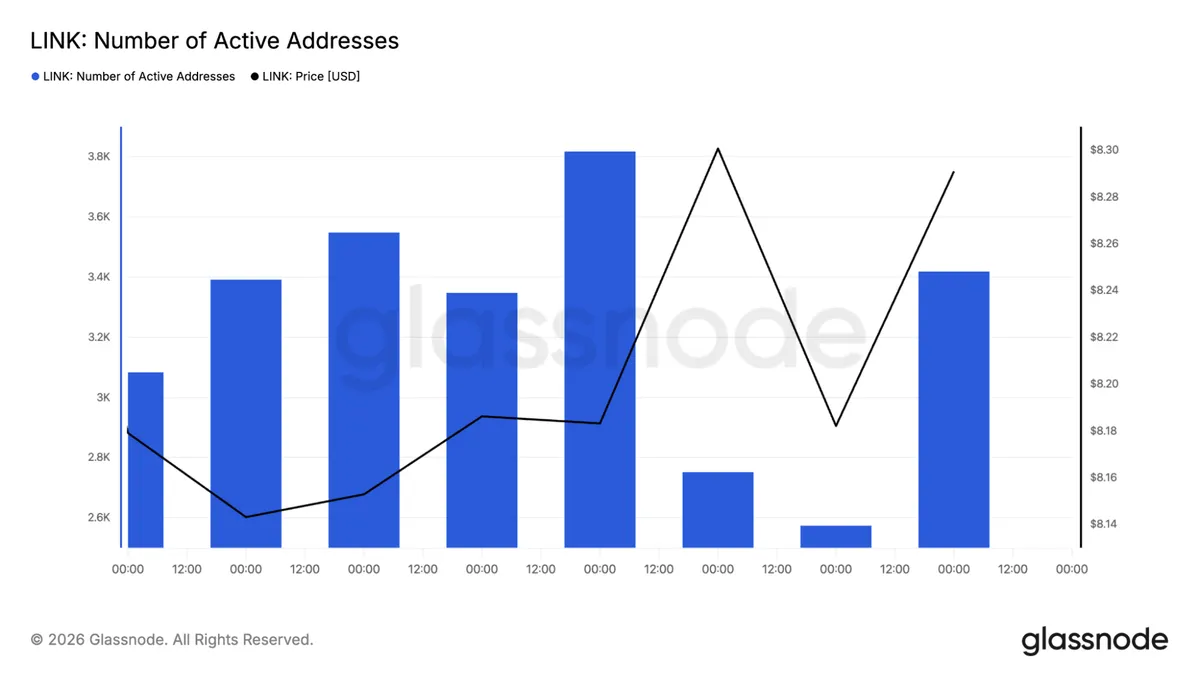
After that local top, both metrics dropped sharply, with active addresses falling to roughly 2.6K and transfers to around 6.2K. That looked like profit-taking and a temporary cooling-off phase.
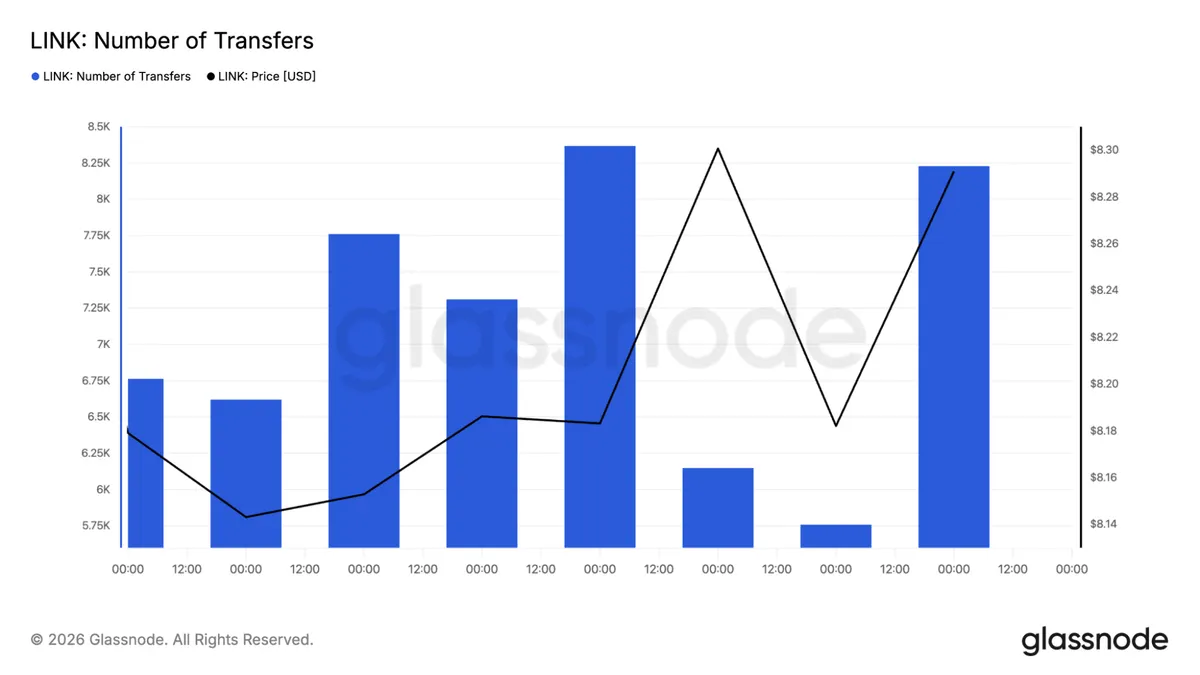
The more encouraging development is what happened afterward. The latest readings showed active addresses recovering to roughly 3.4K and transfers rebounding to about 8.2K at the same time the LINK price returned to the $8.45 area.
What could happen to LINK next?
In the near term, the market is focused on $8.52. A daily close above that level with stronger volume would make $9.50 the next obvious target. A breakout through $9.50 would also break the broader descending trendline and improve the medium-term structure considerably.
If the LINK price gets rejected again at the daily SMA 100, the first support is around $8.00, followed by the stronger demand zone near $7.00. Chainlink is entering a much more interesting phase than it has been in for months. The market does not need to believe in $200 for the LINK price to move materially higher from $8.45.
According to CoinCodex’s 1-month LINK price prediction, the LINK price is projected to trade around $9.77, which is modestly above the current trading area near $8.45. That points to a cautiously bullish near-term outlook.









