



Key highlights:
- The SHIB price is testing a key breakout zone near $0.00000480 after defending support around $0.00000450-$0.00000465
- Whale withdrawals of roughly 74 billion SHIB have reduced near-term sell pressure, even as retail activity stays weak
- Shibarium upgrades and Japan’s Green List approval continue to support the broader SHIB outlook
The SHIB price is sitting at one of those levels that makes traders stop and pay attention. A chart shared by Shib Spain shows SHIB pressing right up against a key resistance area near $0.00000465, and the setup is easy to understand.
The SHIB price is trading around $0.00000462, almost exactly where a falling trendline meets a support zone that buyers have defended several times over the last few weeks. That is why this week feels important. The market is trying to figure out whether SHIB is preparing for another leg higher or simply pausing before the next move lower.
$SHIB IS HEATING UP 🔥
GET READY SOMETHING BIG IS COMING. pic.twitter.com/oDKdFq3qeX— Shib Spain (@ShibSpain) August 9, 2026
The SHIB short-term setup looks interesting
The real battle is happening on the 4-hour chart. SHIB broke above a previous swing high in late July, creating what traders often call a break of structure (BOS). In addition to the rising support trendline on the SHIB price, buyers have been defending higher lows on the digital token.
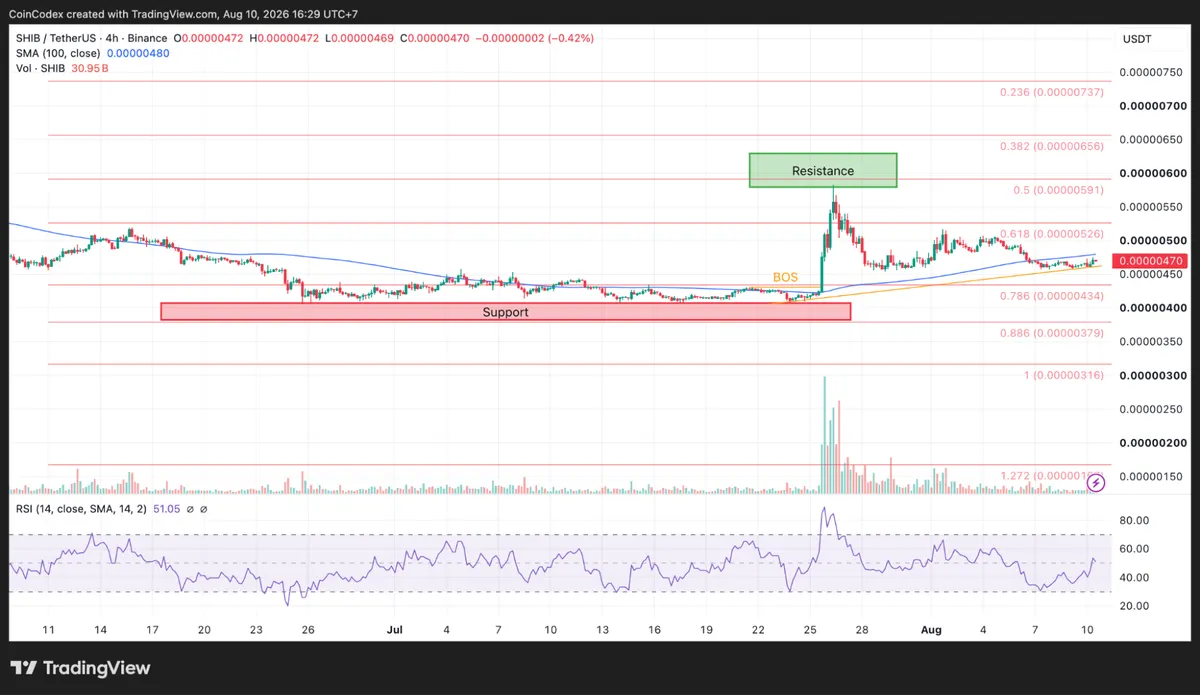
4-hour SHIB chart analysis
The first resistance for the SHIB price is the 4-hour SMA 100 at $0.00000480. This level has been retested several times by the price of SHIB. A 4-hour close above $0.00000480 would be the confirmation of a bullish momentum shift.
Once the SHIB price manages to break above the mentioned level, the first upside target stands at $0.00000526, and afterward, the bulls will look towards a July high near $0.00000600. In terms of downside, there is a clearly defined level too. Below $0.00000450, the rising support line is broken, and the price drifts to the $0.00000400-$0.00000420
Shiba Inu daily chart is still cautious
We had a look at the SHIB chart and the major trend remains down. In terms of the daily timeframe, SHIB continues to form lower highs since reaching its peak close to $0.00001600 in late 2025.
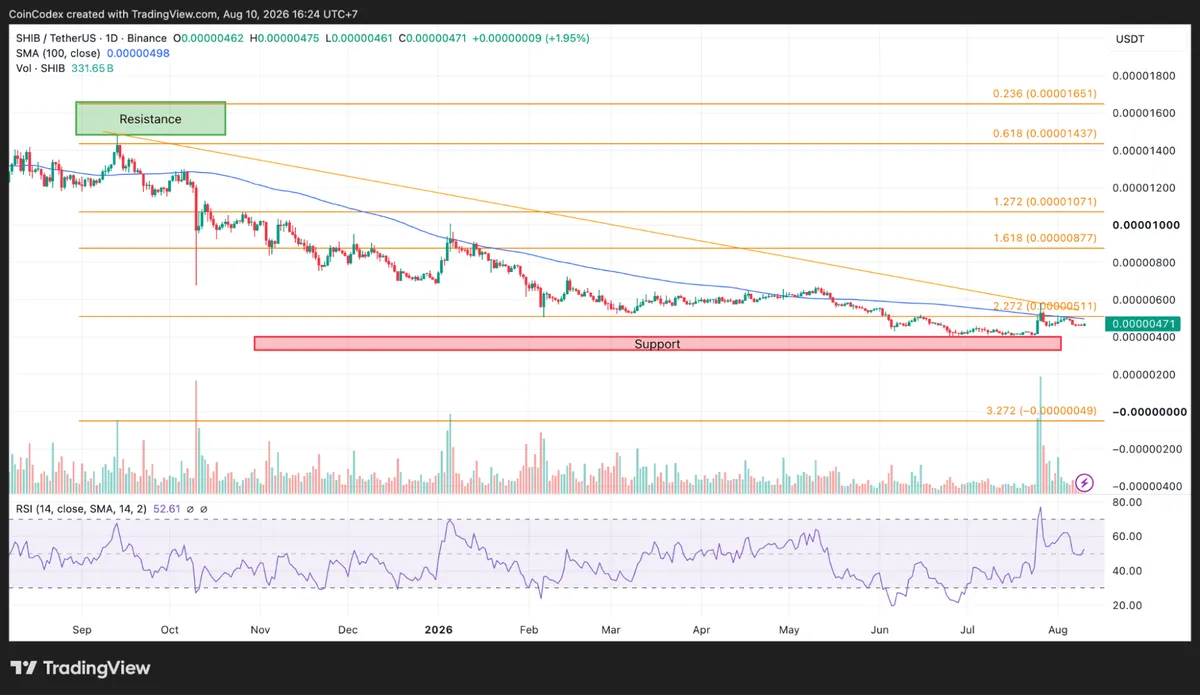
Daily SHIB chart analysis
The descending resistance line off of that high remains intact while the SHIB price is currently trading below its 100-day SMA line at $0.00000498. The encouraging sign here is that the current rally from July came after a period of consolidation in a demand zone around $0.00000300 - $0.00000400.
Buyers were very active in this area, which sent the SHIB price up to the level of $0.00000600 before sellers regained the initiative. Daily momentum indicators are not in an overbought territory. The daily RSI is currently at 52.6.
SHIB whale buying is holding the floor
The on-chain data helps explain why support has been holding. Recent exchange-flow data showed large SHIB withdrawals from exchanges, including moves totaling roughly 74 billion SHIB, which reduced immediate sell-side pressure.
Glassnode’s network data shows a different side of the story. In the mentioned volatility surge that occurred at the end of July, active addresses grew from around 2.1K-2.2K up to 3.9K while the number of transfers increased from approximately 4.2K to 6.4K.
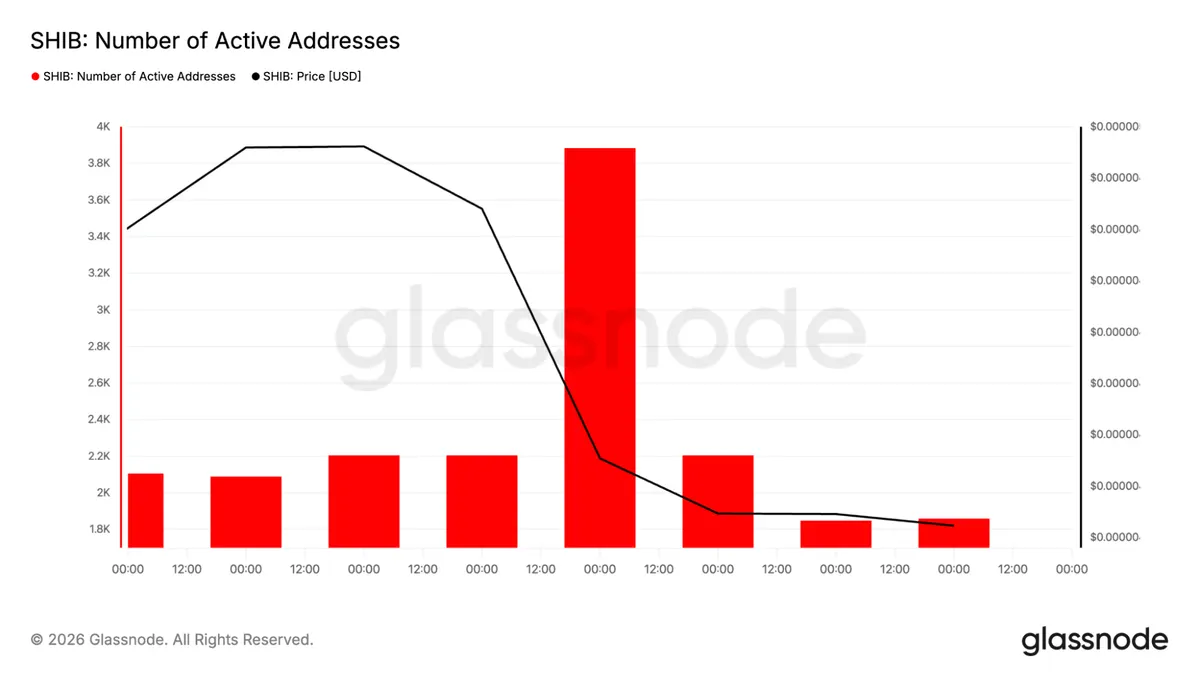
The price of SHIB decreased drastically at the time of this surge; thus, it was not related to retail buying but panic selling along with large transfers. Following this volatility surge, network activity slowed down fast with active addresses and transfers dropping to about 1.8K-1.9K and 3.6K-3.7K respectively.
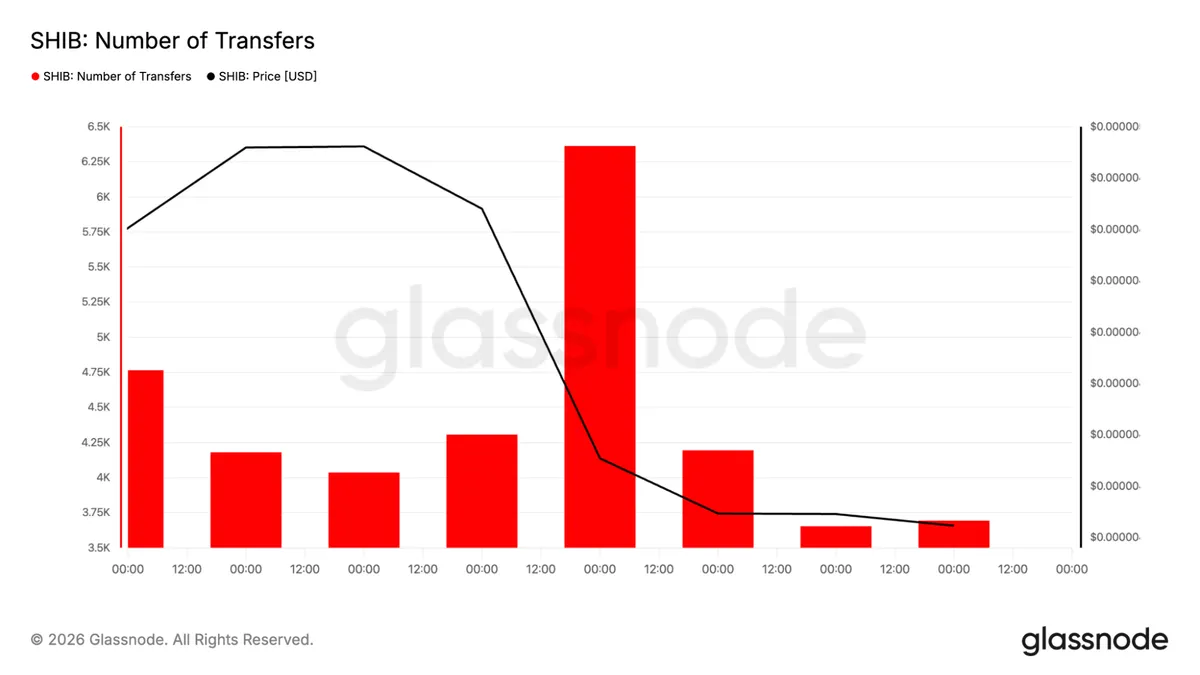
That means the current support zone is being defended mainly by larger holders. Retail participation is still weak, so a breakout will need fresh buying activity to become sustainable.
Shibarium is still the main fundamental story
This is just one aspect of the situation. The SHIB network is still attempting to grow out of its status as a pure meme-coin.
Some of the planned features on Shibarium include Shib Alpha Layer, which is essentially an upgrade to transactions and making it more efficient and easy to develop dApps on top of SHIB, and FHE for 2026.
Network activity has cooled from earlier peaks, with daily transactions falling from the multi-million range into the hundreds of thousands, but development work has continued.
Regulatory positioning has improved as well. SHIB has been included on Japan’s Green List, which makes exchange listings easier in that market and puts SHIB alongside larger approved crypto assets.
Where could the SHIB price go next?
The level traders are watching closely is $0.00000480. If the SHIB price succeeds in breaking out of that range on stronger volume, then the next probable level would be at $0.00000526, and if such a retest is successful, $0.00000600 might come into focus.
Should the bulls fail yet again and the SHIB price fall below the $0.00000450 mark, then the next probable target for the SHIB price would be the support range at $0.00000400-$0.00000420. The overall trend would still be bearish since the descending resistance line on the daily time frame holds firm.
The biggest clue for me is not the price itself. It is whether active addresses recover above roughly 2.5K and transfer count climbs back above 4.5K. If those network metrics improve alongside a price breakout, the setup starts to look much healthier.
According to CoinCodex’s 1-month SHIB price prediction, the SHIB price is projected to trade around $0.000004625, which is almost identical to the current trading area near $0.00000462. That points to a mostly neutral near-term outlook. For now, SHIB is still waiting for confirmation.









