



Key highlights:
- The SOL price remains trapped between $72.8 support and $74.8 resistance
- Solana’s Alpenglow competition and August 22 tokenomics vote are key near-term catalysts
- Active addresses have fallen from 5.4M to 4.5M, pointing to weaker network participation
Solana’s price action is confined to a highly tight range at the moment, and the same $74.8 level keeps repeating itself over and over again. According to analysts, that figure represents the resistance level that needs to be broken for the SOL price action to go bullish. From the chart, buyers have already failed in doing so.
That is why the upcoming move counts so much. The SOL price is currently trading at $73 while being constrained from below by the support of $72.8 and from above by the resistance of $74.8. Whenever a market stays in such a tight range for several days, it means a bigger move is about to happen.
What makes the configuration exciting is that there seems to be some sort of inconsistency between the technical charts, institutional dashboard, and on-chain information.
The SOL price is still trapped below resistance
We took a look at Crypto analyst CW’s 1-hour SOL chart covering late July through early August 2026. The price has tested the $74.8-$74.9 area several times and failed each time. Above that level sits a red resistance band that extends toward roughly $76.5.
The resistance line for $SOL is $74.8.
A breakout of this line is required to transition to a bullish trend. It has failed to break through once. pic.twitter.com/5mSxSSXe9g— CW (@CW8900) August 7, 2026
The dashboard attached to the chart remains cautious. The Anchor Trend has bearish direction, the higher time-frame bias is bearish and the model has a bearish score of 24%, while the bull score is only 3%. The price is trading below the Point of Control, which is close to $73.87, and that is the reason why the model marks the area as a Discount zone.
To put it simply, Solana is trading below its fair value zone and below the algorithmic resistance level, therefore the system did not switch to bull mode. Additionally, there was a decline in activity following the spike in the beginning of August.
The native charts show a bigger squeeze forming
In the 4-hour time frame, the SOL price is trading right around a rising support level, which came into effect following the Break of Structure formation that took place in mid-June. The short-term support holds, although the price continues to trade below the 100-period simple moving average at $74.35, which acts as resistance.
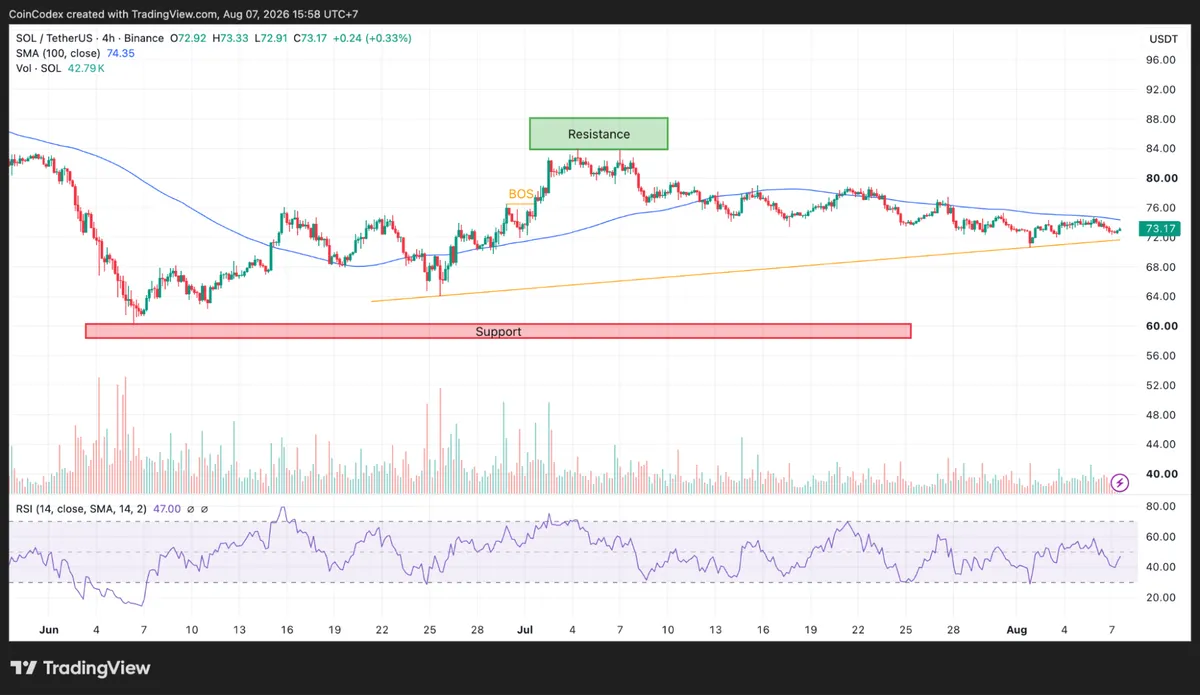
4-hour SOL chart analysis
The daily time frame shows a more bearish setup. Solana is trading from around $270 in October 2025 all the way down to the low $70s, with the SOL price now trading more than 70% off its high. The daily 100-day SMA rests at $77.85, while the descending trendline holds overhead.
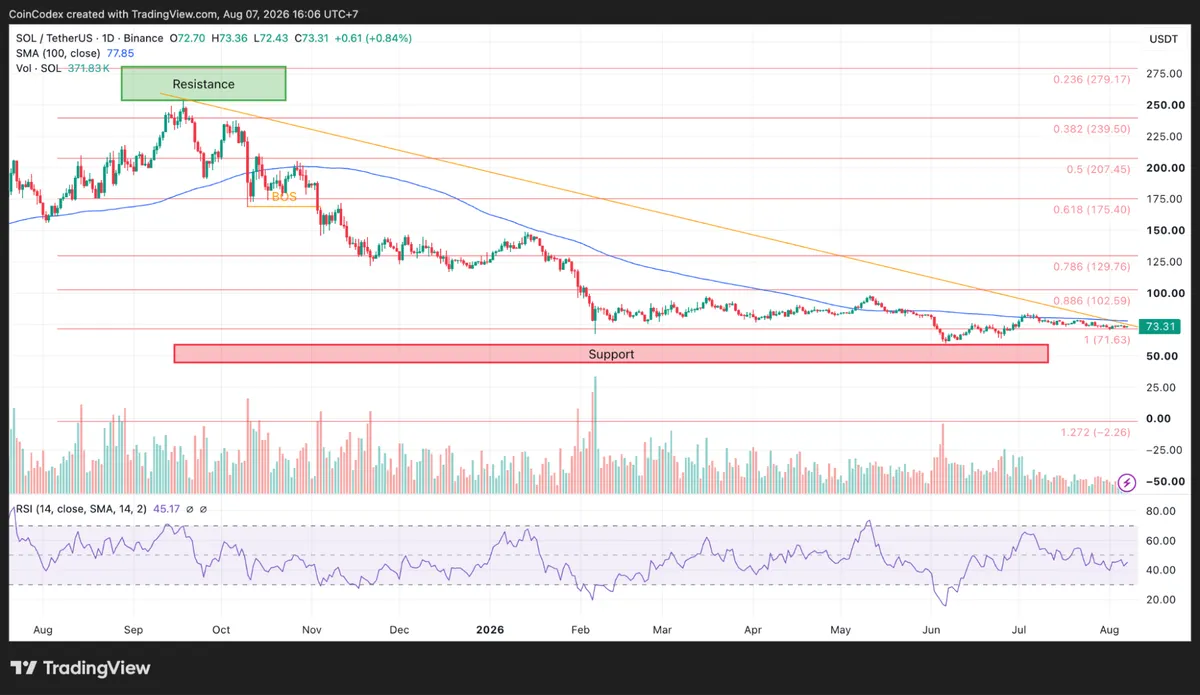
Daily SOL chart analysis
Put together, the charts create a fairly clear roadmap. Bulls first need to reclaim $74.8, then push through $77.85 before the broader trend can start improving. If that happens, the next upside levels are around $84 and later the $102.59 Fibonacci level. If support near $72.5 breaks, traders will likely start watching $68 and potentially the $60 support zone.
Catalysts that could affect the SOL price
Solana also has new fundamental catalysts . The network has launched a dedicated security competition for Alpenglow, its new consensus protocol. The competition offers up to 50,000 SOL in rewards and runs from August 5 through August 19, 2026. Participants must submit findings through the official portal, sign in with GitHub, and pay a 0.5 SOL submission fee.
🚨JUST IN: @Anza_xyz has officially opened submissions for the Alpenglow bug bounty. Up to 50,000 $SOL ($3.8 million) is available to researchers reviewing @Solana's biggest consensus change in history. pic.twitter.com/dDkDirTS2f
— SolanaFloor (@SolanaFloor) August 5, 2026
A major catalyst for the SOL price is Solana’s upcoming governance vote on tokenomics reform. The proposals SGP-0002 and SGP-0003 are in their final discussion phase through August 22, 2026, and they aim to speed up Solana’s disinflation schedule and increase daily SOL burns from network fees.
If approved, fewer new SOL tokens would enter circulation over time, which could improve the scarcity outlook and support sentiment around the SOL price. The vote comes as Solana continues to show strong network activity, including roughly 1.01 billion weekly transactions, $15.7 billion in stablecoin supply, and more than 97% of on-chain tokenized equity trading volume in June 2026.
Traders are also watching the softer side of the story, including $859,455 in net outflows from U.S. spot Solana ETFs on August 6 and the delayed CLARITY Act vote, which has been pushed to September 2026.
The on-chain data is the real wildcard
The on-chain picture is mixed. Daily active addresses have fallen from roughly 5.4 million to about 4.5 million, a drop of nearly 1 million addresses, even though the SOL price has stayed near $72-$73.
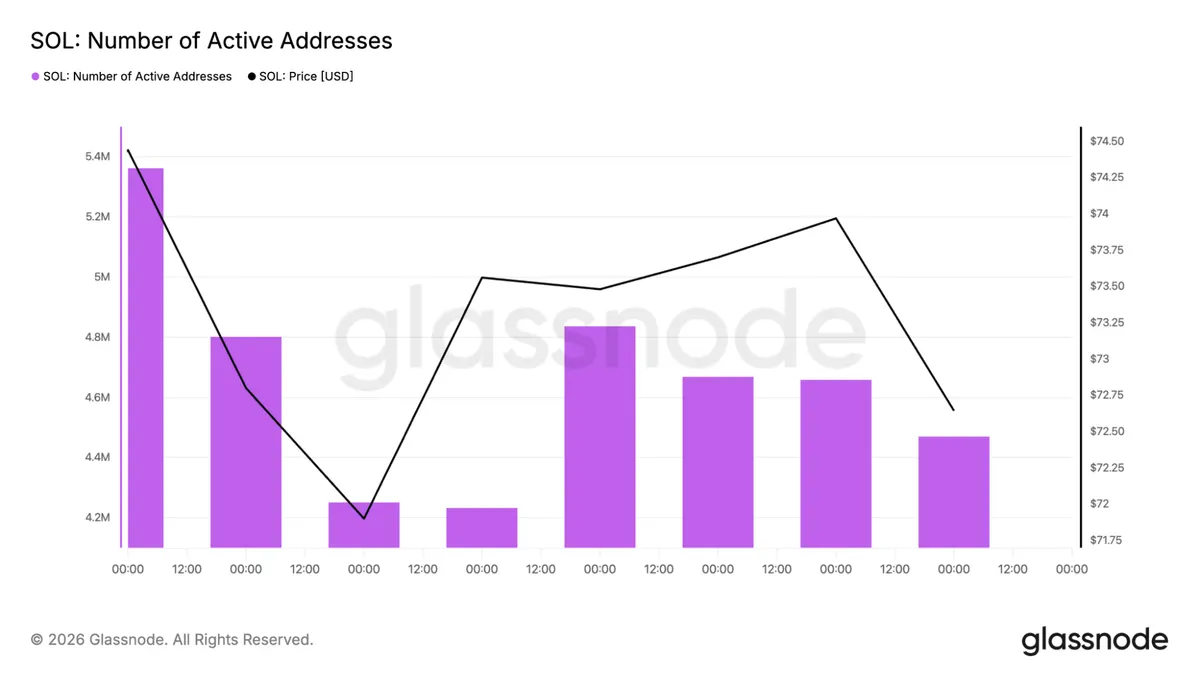
At the same time, daily transfer counts jumped from around 44 million to a peak near 52.8 million before easing back toward 46.5 million. That usually means fewer wallets are using the network, but those wallets are making far more transactions.
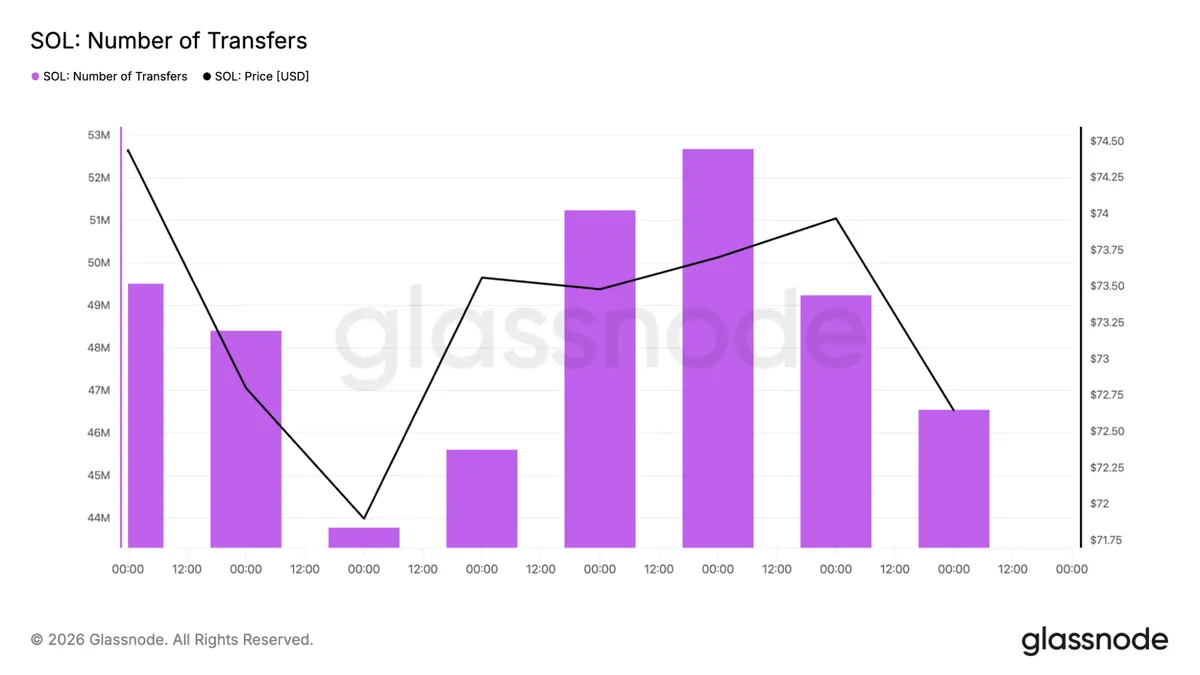
The pattern often points to heavier activity from whales, trading firms, and bots rather than a broad retail return. The latest readings show both active addresses and transfer counts have cooled again, so neither retail participation nor heavy trading activity has fully recovered.
What traders should watch next
The SOL price is in a classic compression setup, and the key levels are unusually clear. A strong move above $74.8 would be the first bullish trigger. If that breakout comes with stronger volume, the market could start targeting $77.85.
The broader trend does not improve meaningfully until the SOL price can reclaim that daily moving average and hold above it. On the downside, a break below $72.5 would weaken the short-term structure and put $68 back on the radar.
According to CoinCodex’s 1-month Solana price prediction, the price is projected to trade around $96.76, indicating a moderately bullish near-term outlook from current level. For now, Solana is still waiting for confirmation. The support zone is holding, but the SOL price has not yet done the one thing bulls need most: break $74.8 and stay above it.









