



Key highlights:
- ETH price is facing a key $1,915 breakout level where falling wedge and 100-day SMA are coming together
- The Ethereum staking percentage has gone to a record high of 34.4% of the total supply
- Transactions per day have gone up to 2.62 million despite active addresses being lower than before
Ethereum is testing one of the most important price levels it has seen in 2026. The ETH price is trading around $1,910-$1,913, and that area is not random. It is where a year-long falling wedge, a major descending trendline, and the 100-day moving average all meet.
That is why traders like Vuori Trading are paying close attention. According to the analyst, a positive breakout above this wedge formation could first aim at levels of $3,300-$4,800, while an even larger bullish scenario would push the price toward $10,000. At the moment, traders are only concerned about whether the price of ETH will be able to hold above $1,915.
The ETH price is pressing against a major resistance zone
We had a look at Vuori’s daily chart, which tracks Ethereum from 2022 through August 2026, and the broader structure still looks constructive. Ethereum remains inside a multi-year ascending channel that has held every major correction since the 2022 bear-market low.
$ETH is trying to escape this 1 year long falling wedge!!
Successful breakout would first send to 3.3-4.8K 🎯
And then most likely all the way up to 10K (ish)
Not FA!#ETH pic.twitter.com/5YgbAWe4Mt— Vuori Trading (@VuoriTrading) August 3, 2026
The lower edge of that channel lines up with horizontal support near $1,500, which helps explain why buyers stepped in aggressively during the June sell-off. The local setup is a large falling wedge that has been developing for roughly a year. The upper boundary of that wedge is now sitting right around $1,850-$1,915.
A daily close above that zone would break the wedge and also reclaim the daily 100-day simple moving average near $1,913.27. If that happens, the next technical levels are fairly clear. The first target is around $2,119, followed by $2,298, and then the larger Fibonacci resistance near $2,875.
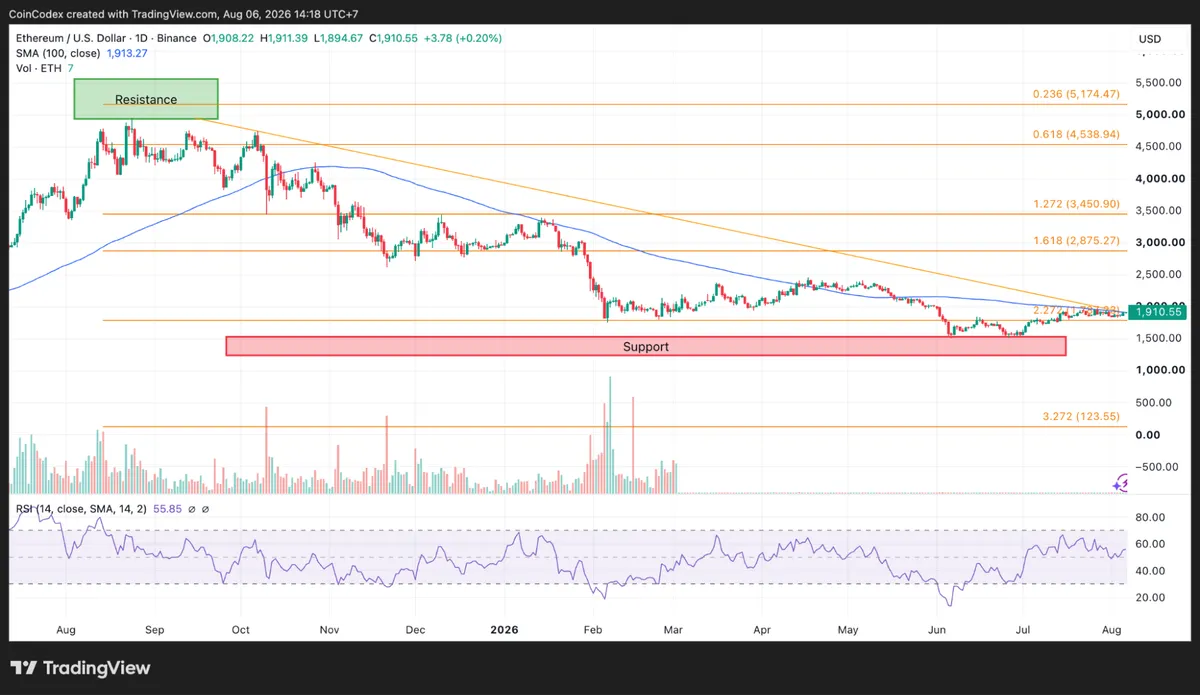
Daily ETH chart analysis
We also took a look at Ethereum’s native daily chart, and it is showing the same thing: the ETH price is running into a major descending resistance line right around the $1,913 100-day SMA, which makes this breakout zone even more important.
ETH momentum has improved, but volume still matters
We had a look at the shorter-term ETH chart, and the momentum picture is clearly better than it was in June.
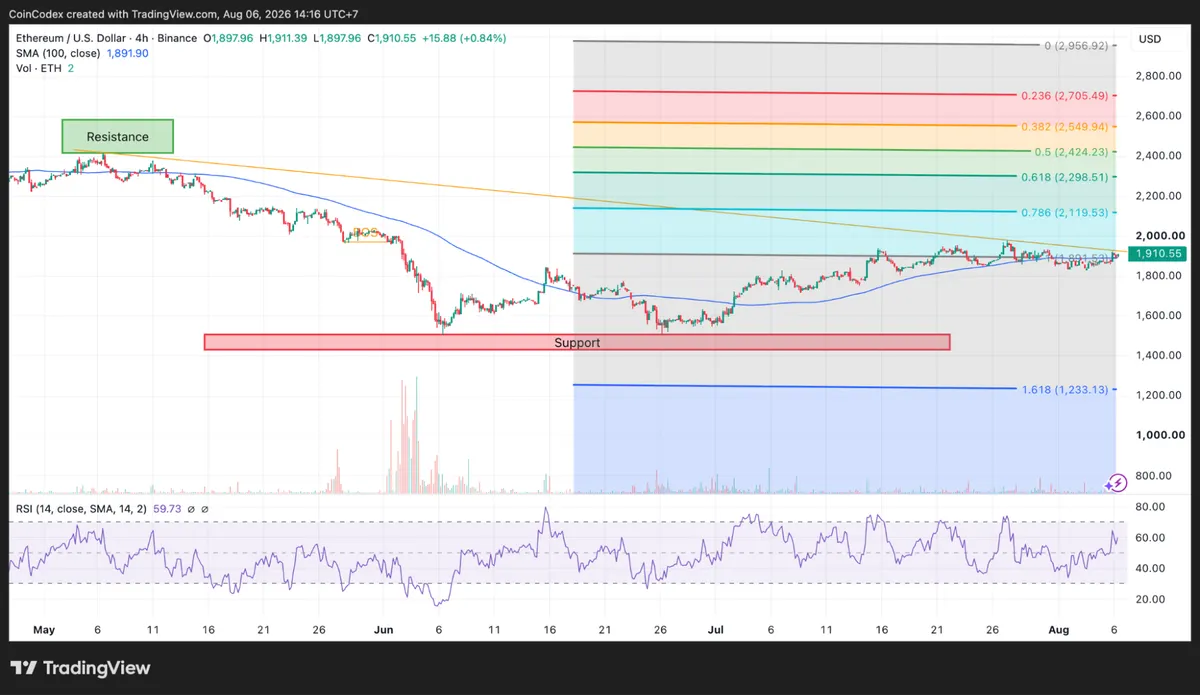
4-hour ETH chart analysis
The ETH price is trading above its 4-hour 100-period SMA at $1,891.90, which is an early sign that buyers have regained short-term control. The chart also shows a prior bullish break of structure before the June capitulation, and price has been recovering steadily from that low.
Momentum indicators support that recovery. The 4-hour RSI is 59.73, which is above neutral but still below overbought territory. The daily RSI is 55.85, leaving room for further upside if resistance breaks.
The one thing bulls still need is stronger volume. Trading activity during this rebound remains noticeably lower than the panic volume recorded during the June decline. For a breakout above $1,915 to carry more weight, traders would ideally want to see a much stronger daily volume expansion.
Ethereum holders are locking up more ETH than ever
One of the strongest bullish arguments is coming from the staking data. According to the Token Terminal data shared by Whale Factor, 34.4% of the total amount of ETH is currently staked, setting a new all-time high record.
🐋 WHALE WATCH : $ETH staking metrics just hit a new All Time High:
=> Staking Ratio: 34.4% (up from 30% in Jan)
=> Trend: Exponential upward slope throughout 2026
=> Source: tokenterminal
Despite yield compression holder conviction has never been stronger. People arent… pic.twitter.com/6o5UixxgNl— Whale Factor (@WhaleFactor) August 5, 2026
The same number was about 30% in January 2026 and has an increasing trend in the chart during the entire year. The reason is that the staked ETH is not part of the circulating supply anymore. Thus, with more than a third of the total supply locked, there is less ETH to trade than ever before.
The data is even more intriguing given the fact that withdrawals on Ethereum had already been allowed after the implementation of the Shapella upgrade. It was thought by many that the development would make more sellers come into the market, but this did not happen since the staking ratio continued to go up to more than 34%.
The Ethereum on-chain data sends mixed signals
However, the on-chain chart is not totally optimistic and should be watched carefully. Active addresses have increased from 340,000 to 420,000 after the period of market correction, yet it remains less than before, which was 450,000.
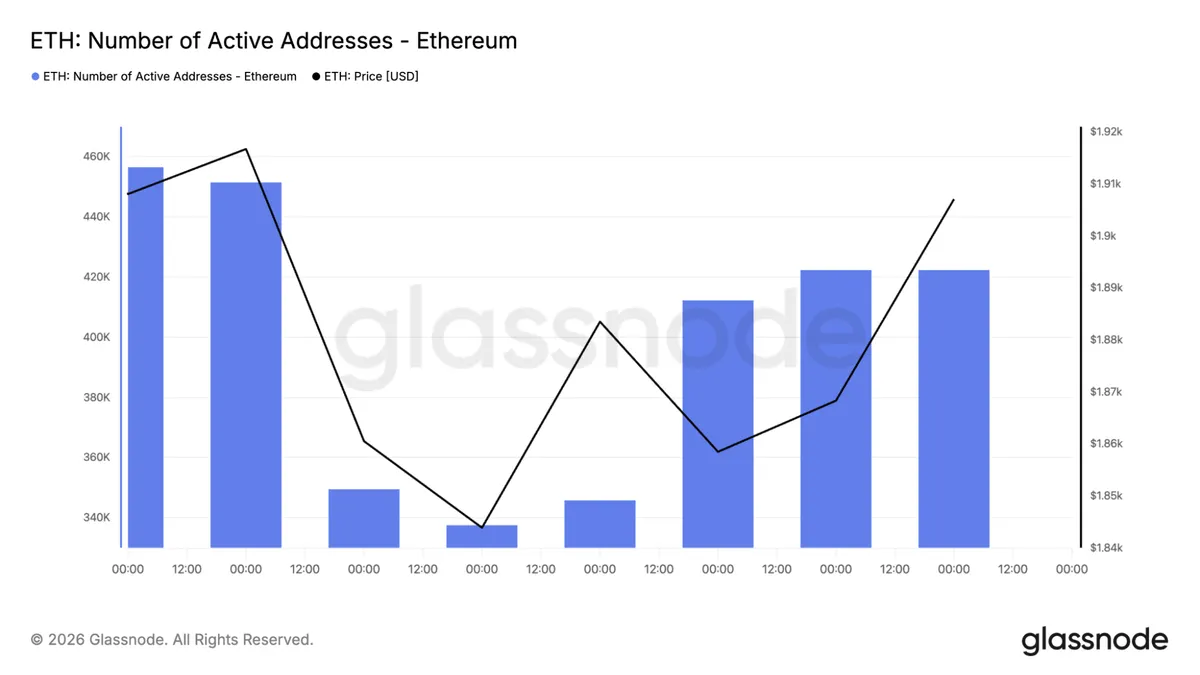
It indicates that currently, there are less wallets than before the last surge, which are involved in performing some activity on the network. The number of transactions seems much greater. Everyday there occur about 2.62 million transactions on Ethereum, whereas it used to be 1.5 million during the drop in prices.
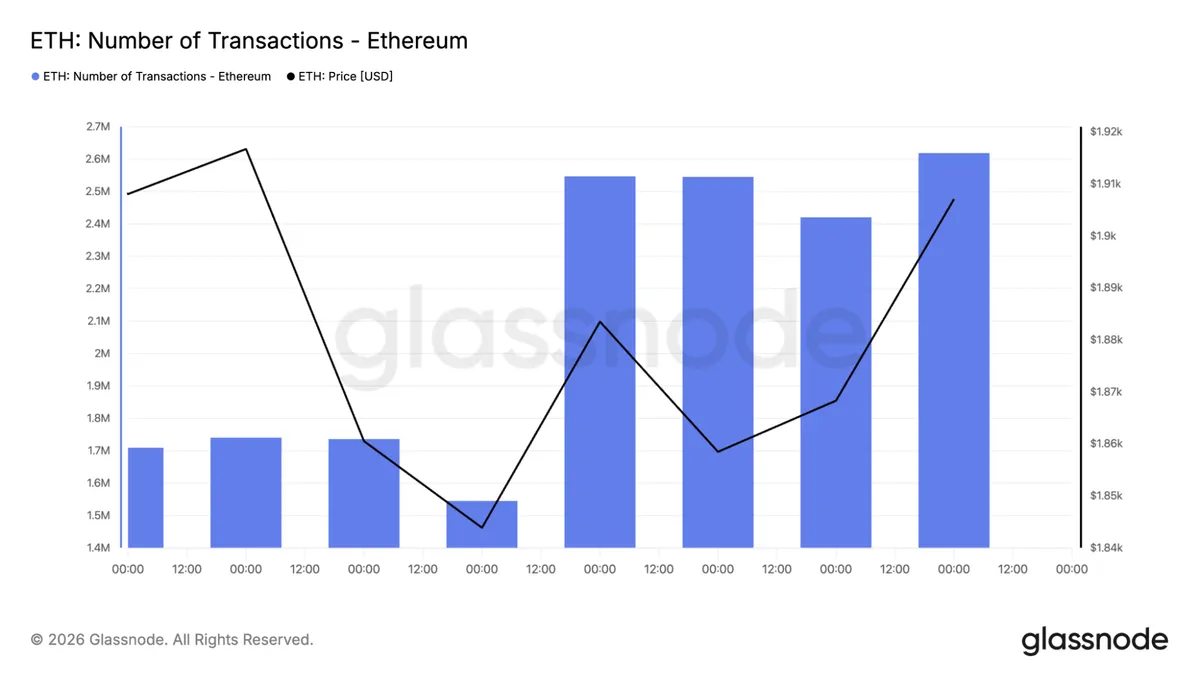
That combination is interesting. The network is processing far more transactions, but those transactions are coming from a smaller pool of active addresses. That often points to heavier activity from larger participants rather than a broad retail return.
What should traders watch next?
The next few daily closes could determine whether Ethereum is beginning a larger recovery or facing another rejection. The most important level remains $1,915. A daily close above that zone, especially if accompanied by stronger volume, would confirm a break of the falling wedge, reclaim the daily 100-day moving average, and strengthen the case for a move toward $2,100-$2,300 initially.
If momentum continues, the larger target near $2,875 comes into view, and Vuori Trading’s broader roadmap points toward $3,385-$4,876 over the next major advance. If the breakout fails, traders will likely watch $1,700 first, followed by the stronger support zone between $1,400 and $1,550.
According to CoinCodex’s 1-month ETH price prediction, the price will be trading at $1,839.09, which means that the outlook for the asset is fairly neutral in the short term, provided the buyers are unable to take ETH past the resistance area of $2,100-$2,300.









