



Key highlights:
- The ZEC price moved back above $500 and is testing the key $518-$520 breakout zone
- ZEC’s market capitalization climbed from about $7.7B to over $8.5B in just a few days
- The Ironwood upgrade, expanding institutional mining, and improved regulatory clarity remain important catalysts for the ZEC price outlook
Zcash is back above the $500 mark, and that has traders asking the obvious question: is this the start of a larger recovery, or is ZEC setting up for another rejection?
The ZEC price climbed to roughly $518 during the latest rally after recovering from the dramatic June collapse that briefly pushed the token into the $210-$250 range and analysts say ZEC has been stuck in a broad trading range for months.
The interesting part is that the charts do show a range, but they also show improving macro structure, fresh capital inflows, and several fundamental catalysts working in Zcash’s favor.
ZEC is still trading inside a very large range
We had a look at the chart shared by Sjuul from AltCryptoGems and that stretches from November 2025 through August 2026, and the structure is pretty clear.
$ZEC price action has been extremely range-bound lately.
First, we got a deviation at support, a bullish retest, and price went straight to resistance.
Now we have a deviation above resistance and a bearish retest, so it seems that price is destined for a visit to support once… pic.twitter.com/YbdFD3MRSu— Sjuul | AltCryptoGems (@AltCryptoGems) August 4, 2026
From February through mid-April, ZEC spent months consolidating between roughly $275 and $300. Traders often view that kind of rounded bottom as an accumulation zone. The breakout finally arrived in late April, and the ZEC price rallied from about $300 to roughly $650-$680.
Then came the June wipeout. Price fell from above $600 and printed a huge wick down into the $250-$275 area before bouncing back. That move is the reason many traders are treating the June low as a liquidity grab rather than a complete breakdown.
The key levels are straightforward. Resistance remains near $575-$580, where ZEC was rejected in both June and July. Support remains near $285-$300, the same zone that held during the accumulation phase and during the June panic.
The ZEC price is testing a critical breakout level
We had a look at the shorter-term chart, and the immediate setup is becoming much more interesting. The ZEC price moved above the 100-period simple moving average near $492.66, which is a short-term bullish signal.
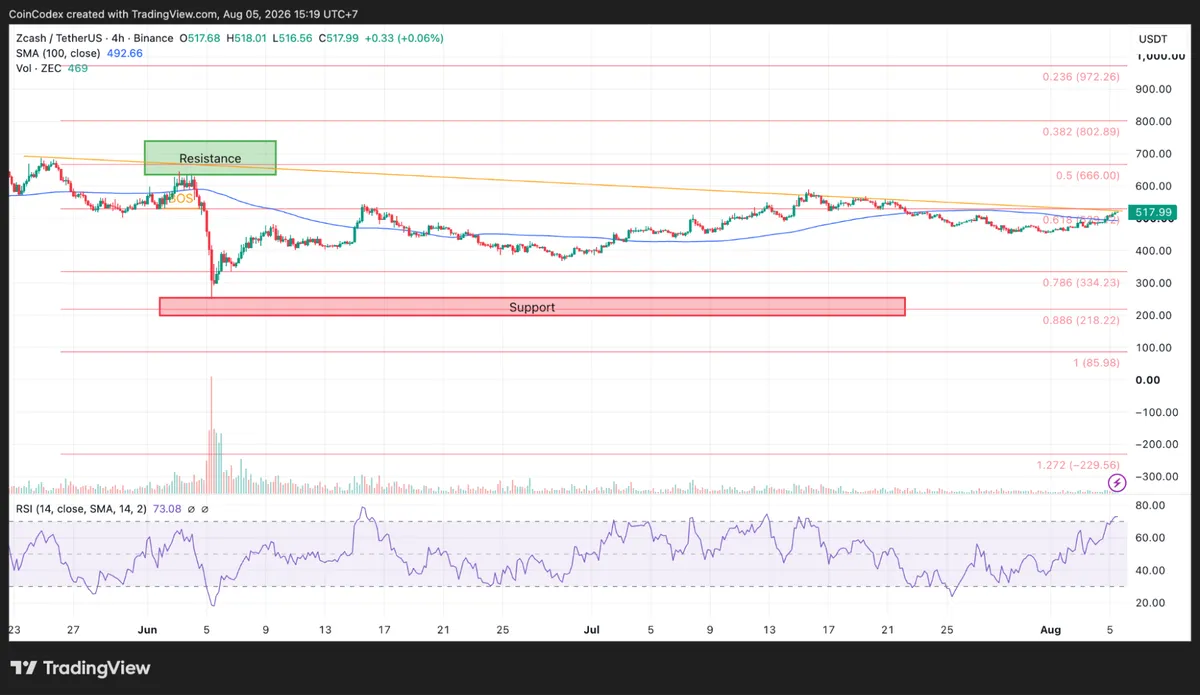
4-hour ZEC chart analysis
The price is also pressing against a descending resistance trendline around $518-$520. If ZEC can close cleanly above that trendline, it would complete a short-term breakout from the recovery structure that has been forming since June. The caution comes from momentum.
The 4-hour RSI is around 73.08, which indicates overbought conditions. There has been little volume increase during the breakout attempt. It may be noted that the RSI being overbought does not imply a reversal, but the probability of consolidation or even failed breakout increases.
The ZEC daily chart actually looks healthier
The daily chart tells a much less bearish story. We had a look at the broader ZEC chart, and one detail stands out: the market already printed a Break of Structure (BOS) to the upside in mid-April.
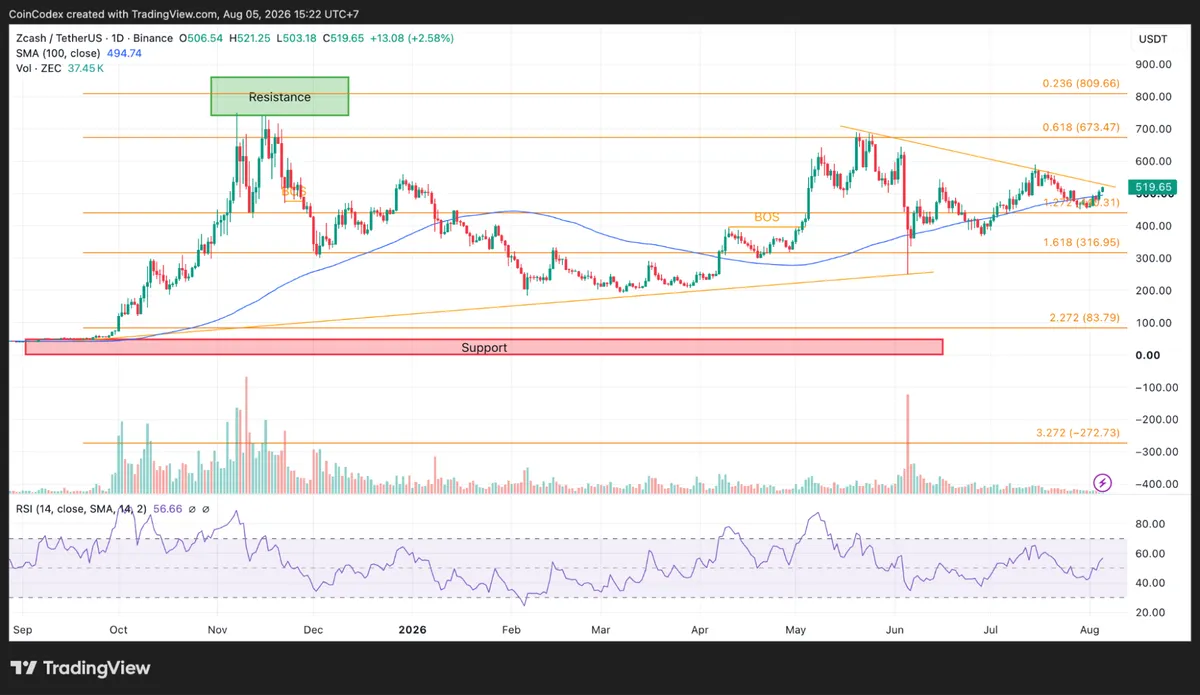
Daily ZEC chart analysis
ZEC is trading above its 100-day SMA at $494.74, and the daily RSI is at 56.66, comfortably below the overbought levels. This implies that the macro chart has more upside to it as long as the buyers are able to overcome resistance.
The next key level on the upside is the 0.618 Fibonacci retracement at $673.47. Any close above $520 will set sights on this level, and above this lies the next key historical resistance at $800.
Fresh money is flowing back into ZEC
The on-chain data from Glassnode confirms that real capital has entered the market during this rebound. Over roughly 48-72 hours, ZEC’s market cap increased from about $7.7-$7.8 billion to more than $8.5 billion, and the ZEC price moved from roughly $460-$465 to above $505 during the same period.
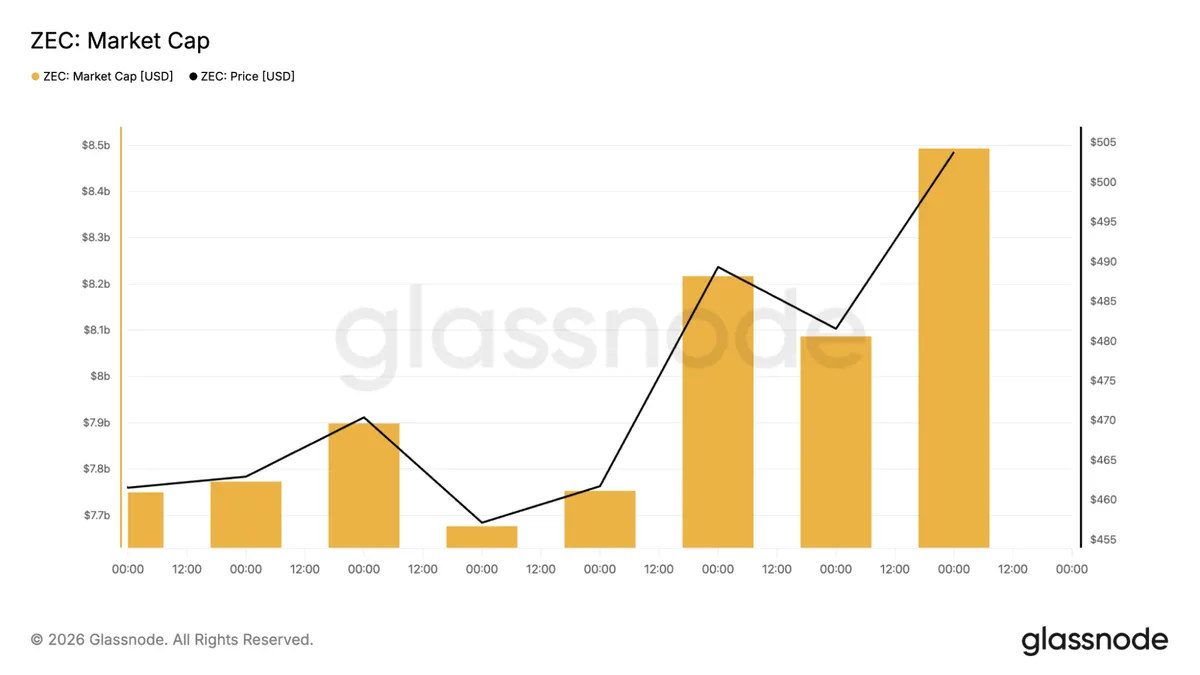
That is nearly $800 million in additional market value in just a few days. Because circulating supply changed very little during that window, the increase points directly to buying activity. In other words, the move above $500 was backed by real money entering the market.
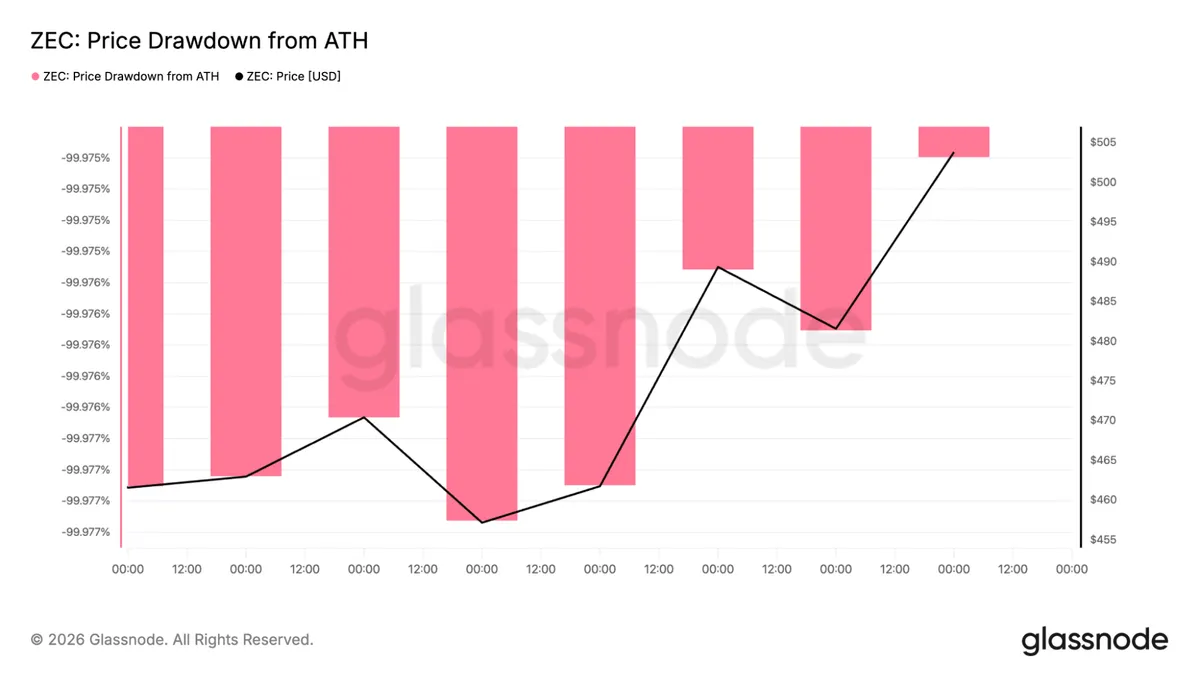
Even after reclaiming $500, the ZEC price remains roughly 99.975% below its all-time high, which was above $3,000 during the 2017-2018 cycle. The recent move from $460 to above $505 improved that drawdown only slightly. ZEC still has a very long road ahead before anyone can talk about a full-cycle recovery.
Ironwood and institutional mining are important catalysts
Zcash activated the Ironwood hard fork (NU6.3) on July 28, 2026. The upgrade introduces a new shielded pool and a turnstile mechanism designed to make the total supply mathematically verifiable after earlier concerns tied to the Orchard pool.
If Ironwood performs as expected, it could improve confidence in Zcash’s privacy model and supply integrity. Institutional mining is also expanding. Fortitude, backed by Digital Currency Group, is increasing its mining capacity beyond 60 MW and targeting production costs near $40 per ZEC.
Lower production costs could reduce miner sell pressure if a larger share of mined coins is held instead of sold immediately. The regulatory picture has improved as well. The SEC closed its investigation into the Zcash Foundation without enforcement action, removing a major uncertainty that had weighed on sentiment.
What should traders watch next?
The next few trading sessions could decide whether ZEC is breaking out or setting up another fakeout. The most important level is $520. Closing the day with a strong close above this range, especially with much higher volume, will reinforce the positive picture and put the $575-$580 and $673 ranges on the radar screen.
In case of failure at the resistance level, the overbought situation on the short term leaves some space for a fall to the $492-$495 and even $450-$400 range levels.
According to CoinCodex’s 1-month ZEC price prediction, the ZEC price is projected to trade around $709.18, indicating meaningful upside potential from the current level if buyers can continue holding the $492-$500 support zone and reclaim the key $520 resistance area in the coming weeks.









