
Key highlights:
- Michael Saylor states that Bitcoin is now trading near its 200-week moving average
- The cryptocurrency has traded above its 200W MA for about 92% of the time
- Speculations rise about Strategy’s potential Bitcoin purchases
Michael Saylor’s Strategy (formerly MicroStrategy) has grabbed the crypto market’s attention with a new way of tracking the Bitcoin price’s long-term performance. As announced by the founder, the company is now tracking the cryptocurrency’s 200-week moving average (200W MA) and its premium or discount to that level.
Significantly, the Bitcoin treasury company’s update came at a critical time. The BTC price has been trading close to the 200W MA. This is a price level many experts see as a key support zone during market corrections. As Saylor highlighted the indicator as one of BTC’s most important long-term price benchmarks, investors are closely watching the level to see if the cryptocurrency can hold above this crucial zone.
Why is Michael Saylor tracking Bitcoin’s 200W MA?
Earlier today, Strategy founder Michael Saylor shared an X post, highlighting that the company is now tracking Bitcoin’s 200-week moving average, along with its premium or discount. He noted that BTC traded above its 200W MA for about 92% of the time since the metric became available. The Bitcoin advocate’s latest post reinforces the belief that the 200W MA is a key point for long-term BTC investors and traders.
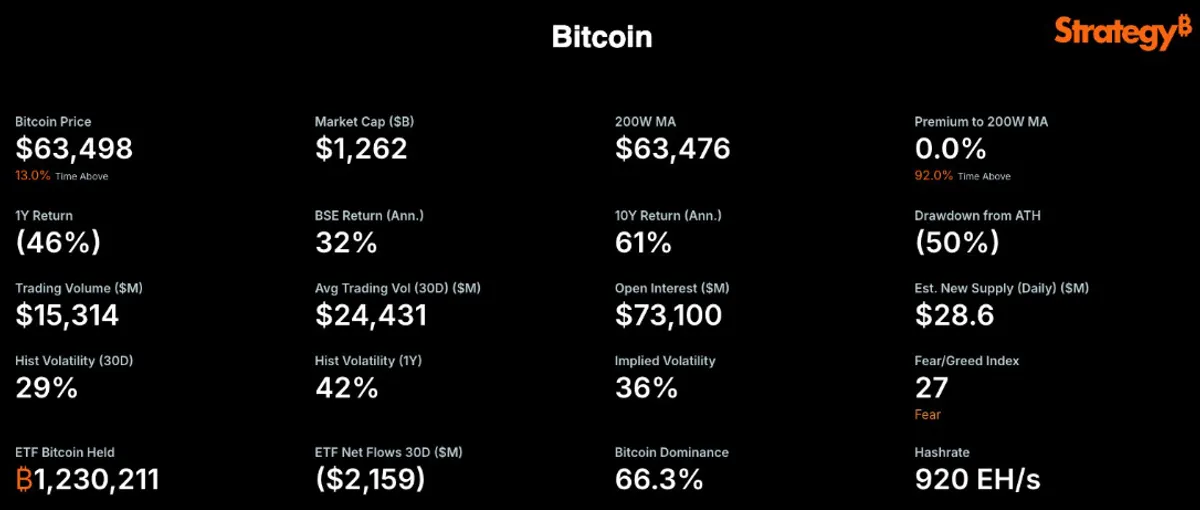
Source: Strategy
Notably, the 200W MA is one of the most widely used long-term technical indicators in the Bitcoin market. It mainly represents the average closing price of the crypto over the past 200 weeks, about four years. Thus, the indicator helps assess the Bitcoin price’s long-term trend while analysing short-term fluctuations.
Historically, the 200W MA has been considered a strong support level during major market downturns. If BTC trades near or below this level, traders see it as a possible accumulation zone. At the same time, if the Bitcoin price manages to hold significantly above the level, it is seen as a sign of long-term growth. As Michael Saylor revealed that BTC is hovering around this indicator, the community remains bullish. Investors and traders are closely watching the level to see the crypto’s potential movements.
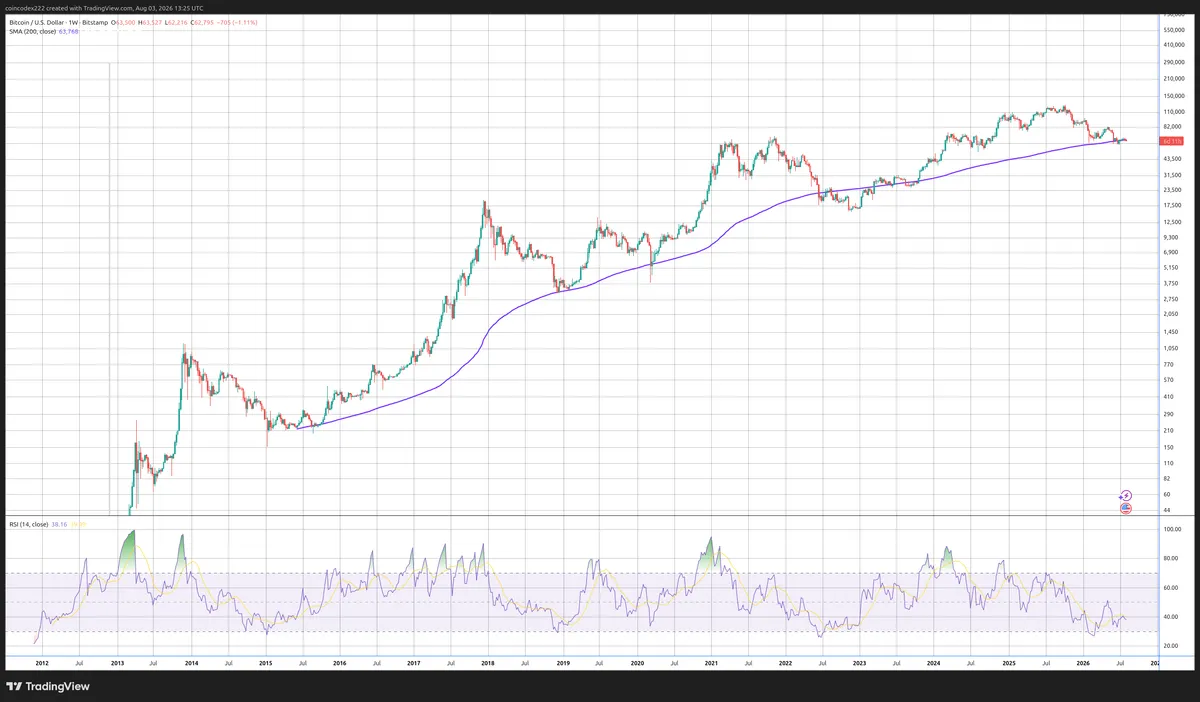
Long-term Bitcoin price chart with 200-week simple moving average (purple).
Bitcoin price tests key support
As Michael Saylor noted, the Bitcoin price is currently trading near the 200W MA. Looking deeper into the technical details, BTC is near a crucial support zone of $62,226. At the same time, the 7-day Relative Strength Index (RSI) stands at 39.47, signaling bearish momentum.
As of press time, BTC is valued at $62,686, down 0.62% in a day. Despite a marginal 0.5% monthly uptrend, the pioneer crypto has plunged by 3.6% over the past seven days. If BTC closes below the support of $62,226, the next major price level is expected to be $61,000. If BTC climbs back above $62,659, it could signal a short-term uptrend.
Will Strategy purchase new BTCs?
Michael Saylor’s latest Bitcoin price analysis post comes amid increasing discussions on Strategy’s new BTC buys. Over the past five weeks, the company hasn’t made any new BTC purchases, shifting its focus to strengthening its cash reserves.
On Sunday, Michael Saylor shared a post incorporating a Bitcoin chart with a caption, “Bitcoin Drive engaged.” While this came like his regular Sunday posts, it has sparked speculation among community members that the company would soon resume its Bitcoin accumulation strategy.