


Key highlights:
- Peru supplies one-sixth of global silver output, keeping supply risks in focus for precious-metals traders
- The silver price has slipped below the key $61.50 level, and analysts are watching whether it can reclaim that level
- CoinCodex’s 1-month prediction points to $64.68, but the chart remains trapped between $56 support and $61.50 resistance
Silver is one of the most interesting markets to monitor now. Geopolitical tensions were the main headlines for July, while another story may prove to have some long-term implications. As reported by Kitco News, almost one-sixth of the total global mined silver comes from Peru.
Currently, the silver price is at about $59.43. The gold-to-silver ratio is at 69, which means that one ounce of gold would cost 69 ounces of silver. Generally, the ratio is viewed as a signal for determining the price of silver compared to gold.
When the gold-to-silver ratio hits its highs historically, then this implies that the silver price is quite low. Though the metal retreated from its record-high level of $121.62 seen in January, it still trades 50% higher than a year ago.
Why Peru matters in silver's story
This is not a temporary headline. Silver production by Peru is about 16-17 percent of total world production of silver, and for this reason, Peru ranks among the key countries in terms of silver production.
Silver's Peru problem: A local risk the global deficit can't absorb
The loudest #silver story in July was a shooting war, but the more durable threat was a peaceful election in Peru, a country that digs up close to one silver ounce in six.
Silver trades near $59.43 an ounce as… pic.twitter.com/NRPo06vImJ— Kitco NEWS (@KitcoNewsNOW) July 30, 2026
Problems in Peru’s silver production cannot be made up soon, and hence traders keep following political events in Peru. Silver is also a much smaller market than gold, so supply disruptions tend to have a bigger effect on sentiment.
Even traders who are cautious in the short term generally agree that a prolonged disruption in Peru would tighten the physical market. The challenge is that this supply story shared by Kitco News is arriving at a time when the silver price is also dealing with an important technical test.
The silver price is now battling this key level
DeepValue Signals has been focusing heavily on $61.50, and I can see why. The silver price has already slipped below that level on the daily chart and has not managed to reclaim it.
Is $500 $SILVER still possible one day? Likely. But that is not the chart in front of us today.
Silver has now reached the first major support area around $54–$56, exactly as discussed. But do not blindly anchor yourself to the famous monthly or weekly cup-and-handle chart being… pic.twitter.com/jRiLoYcest— DeepValue Signals (@DVSignals) August 1, 2026
That changes the short-term conversation. A lot of bullish silver commentary has been centered on the large monthly cup-and-handle pattern that points to much higher prices over time. DeepValue Signals is making a different argument: the chart traders are looking at today is not yet confirming an immediate move back to new highs.
Moreover, the analyst observed that the present consolidation is starting to resemble a bearish continuation triangle. This does not necessarily mean that a breakdown is imminent, but it certainly signals that the possibility of a downside move needs to be considered.
The Silver chart is tightening ahead of a bigger move
We had a look at the silver chart, and the key feature is the tightening range between support and resistance. On the intraday chart, we see the silver price being traded in a large symmetrical triangle pattern.
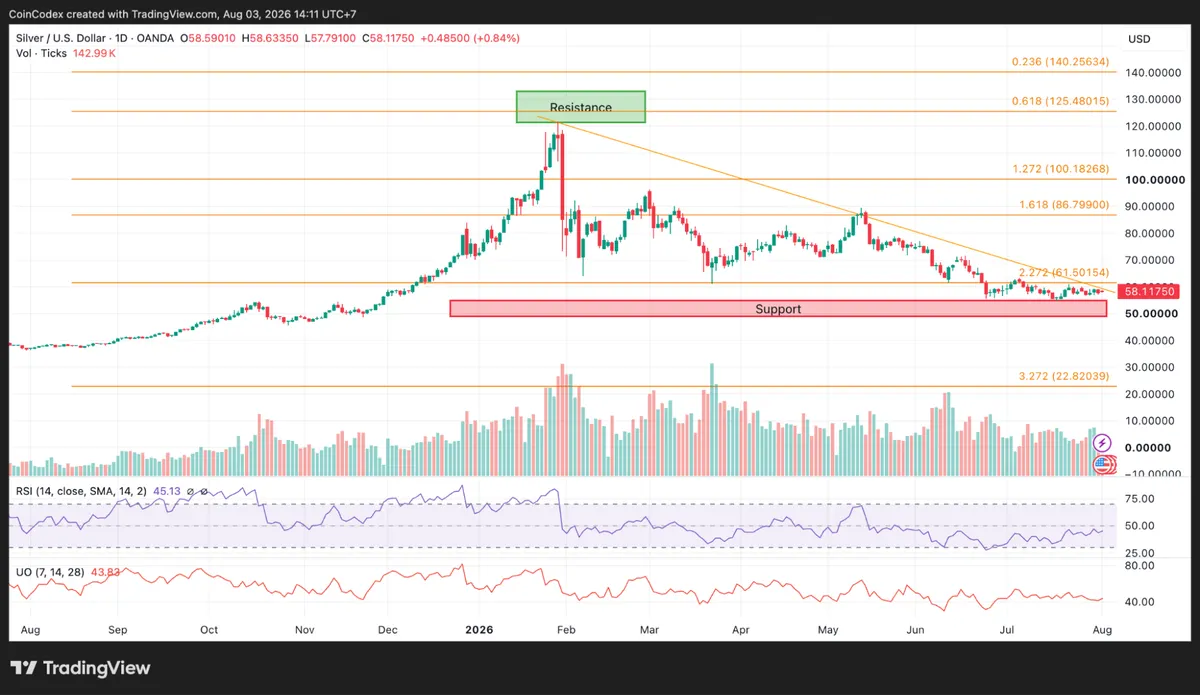
Daily silver chart analysis
The support area is between $56-$58, while the resistance stands at $60-$61.50. As the price moves towards the top of the symmetrical triangle, the range keeps getting narrowed, making a typical price formation that usually precedes a large move.
Momentum indicators do not show any bullish signals yet. Both on a daily basis and an intraday one, the RSI oscillates at 45 level, while the Ultimate Oscillator is around 44, both below the neutral line of 50. Momentum has stabilized but did not start a new uptrend yet.
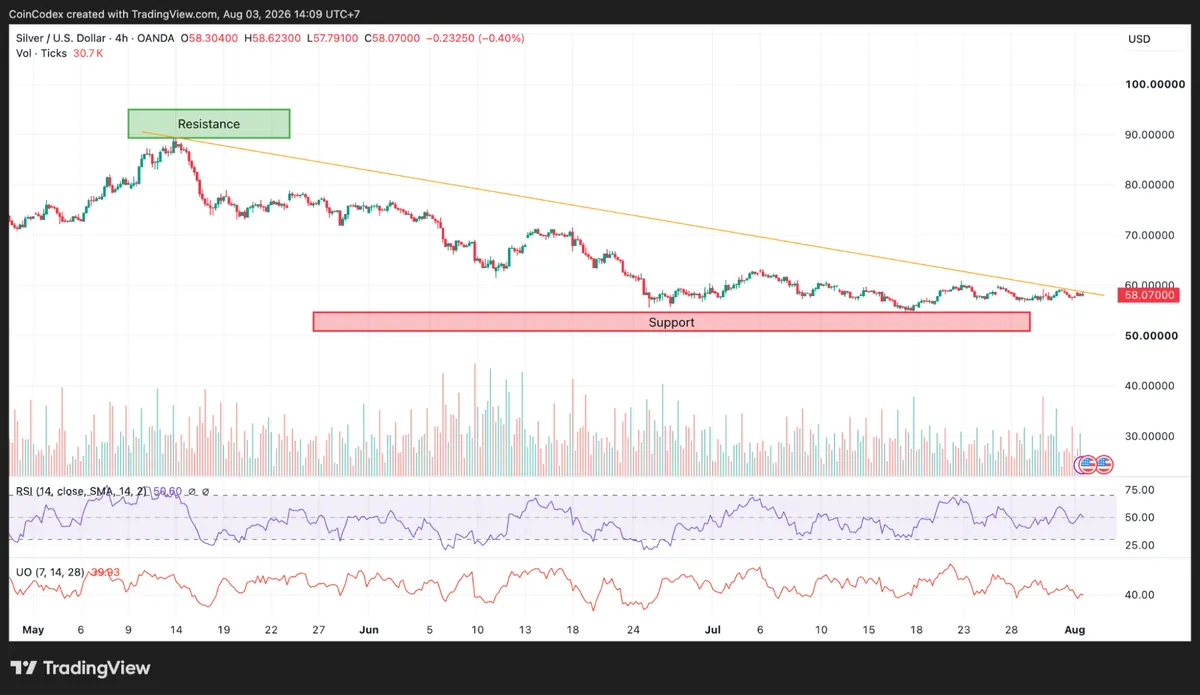
4-hour silver chart analysis
The 4-hour chart also shows similar compression, while volumes have continued to fall as the range has tightened. It normally implies that the market is waiting for a breakout before taking any position.
Why some analysts still see another silver shakeout
Sprott Money shared comments from portfolio manager Bob Thompson, who argued that silver holding above its historic breakout area is still meaningful. He also warned that silver is volatile enough to shake investors out before a larger advance resumes.
As Thompson put it himself, it will not be surprising if we were to see a temporary retrace into the $47-$48 region despite it being not Thompson’s base case outlook. From the perspective of the technical chart, it is clear why, as the next key level of support lies somewhere around $47-$50.
🚨 “Silver could revisit $47 or $48 just to shake out investors.” — Bob Thompson
In this latest discussion with Craig Hemke, Bob Thompson explains why silver's ability to hold above its historic breakout level is significant, why volatility is expected in a small market, and why… pic.twitter.com/lyXaKIeIgp— Sprott Money (@SprottMoney) August 2, 2026
With all of the above technical reasons for pessimism notwithstanding, the bullish argument is not yet dead. For one, the silver price stands significantly above where it was before the breakout in 2025. And the Peruvian silver supply factor remains in play, alongside the gold-to-silver ratio at 69.
For the bulls, the signal is clear: silver has to retake $61.50. A robust close above that level on any given day, particularly on high volume, would be the first indication that the bulls have taken back control. If this occurs, then the next level above is about $70-$75, which silver consolidated at during the early part of the year.
Where can the silver price go in August?
For August, the silver price is trapped in a $56-$61.50 decision zone. As long as silver stays below $61.50, I would treat rallies as recovery attempts inside a broader correction. A breakout above that level would improve the outlook significantly and put $70+ back on the table.
If support near $56 breaks, I would expect the market to test the high-$40s to low-$50s before stronger buyers are likely to emerge. What stands out to me is that the fundamental story and the technical story are pointing in different directions.
Peru supply risk supports the longer-term bullish argument, but the chart is still asking silver to prove that the correction from $120 has finished. The next decisive move is likely to come from whichever side wins the battle between $56 support and $61.50 resistance.
According to CoinCodex’s 1-month silver price forecast, the price is projected to trade around $64.68, indicating moderate upside potential from current levels if buyers can hold the $56-$58 support zone and reclaim the key $61.50 resistance area in the coming weeks.








