



Key highlights:
- The AVAX price is trading near $6.42-$6.48, with $6.00 remaining the key support level
- Analyst says similar AVAX chart structures preceded major rallies in 2020, 2021, and 2024
- AVAX is still below its 100-period moving average near $6.54, keeping short-term momentum under pressure
Avalanche is once again back to a point where traders are getting interested. The AVAX price is currently trading within the $6.40-$6.50 range which is just above its intraday lows of $6.41. It may not seem too impressive at first, particularly when you consider what the token is worth.
According to crypto analyst Crypto Patel, such a chart formation requires closer inspection. He notes that in past AVAX cycles, a breakout coupled with a retest was responsible for large price runs in 2020, 2021, and 2024.
The AVAX price is still stuck in a long-term bear market
We analyzed Patel’s chart, and the overall trend is still distinctly bearish. AVAX reached an all-time high of $141.64 in 2025 and has since fallen to about $6.48, representing a decline of 95.4% from its peak price level.
The 2-week chart continues to show lower highs and lower lows, indicating that the overall downtrend is still intact. The initial resistance is at the $10 price level, and the second is at the $15 level, while the third resistance is at the $20 price level.
$AVAX Has Never Failed This Macro Setup 🚀
2020: Breakout + Retest = 2,000% Rally
2021: Breakout + Retest = 1,500% Rally
2024: Breakout + Retest = 660% Rally
2026: Strong Holding Same Support = Confirmed? 🚀
History Doesn't Guarantee The Future...
But #AVAX Has A 100% Success… pic.twitter.com/1c60KYQlic— Crypto Patel (@CryptoPatel) July 30, 2026
Support is easier to define. The current area around $6.40-$6.00 is the first zone bulls are trying to defend. If that level gives way, traders will likely start watching $5.50, then $5.00, and eventually the $4.00 area indicated by Patel.
Patel’s thesis is based on historical pattern repetition. In previous cycles, AVAX broke down, retested major support, and then produced large percentage rallies. The current price is trading almost exactly where his projected accumulation zone begins.
He is not calling for an immediate breakout. His argument is that this area could become attractive for longer-term investors if support continues to hold. That distinction matters. The chart is not confirming a new bull market today. It is showing a market trying to stabilize after a multi-year decline.
AVAX short-term chart is still under pressure
The shorter-term picture is less encouraging. We had a look at the 4-hour AVAX chart, and the token is trading below its 100-period moving average near $6.54.
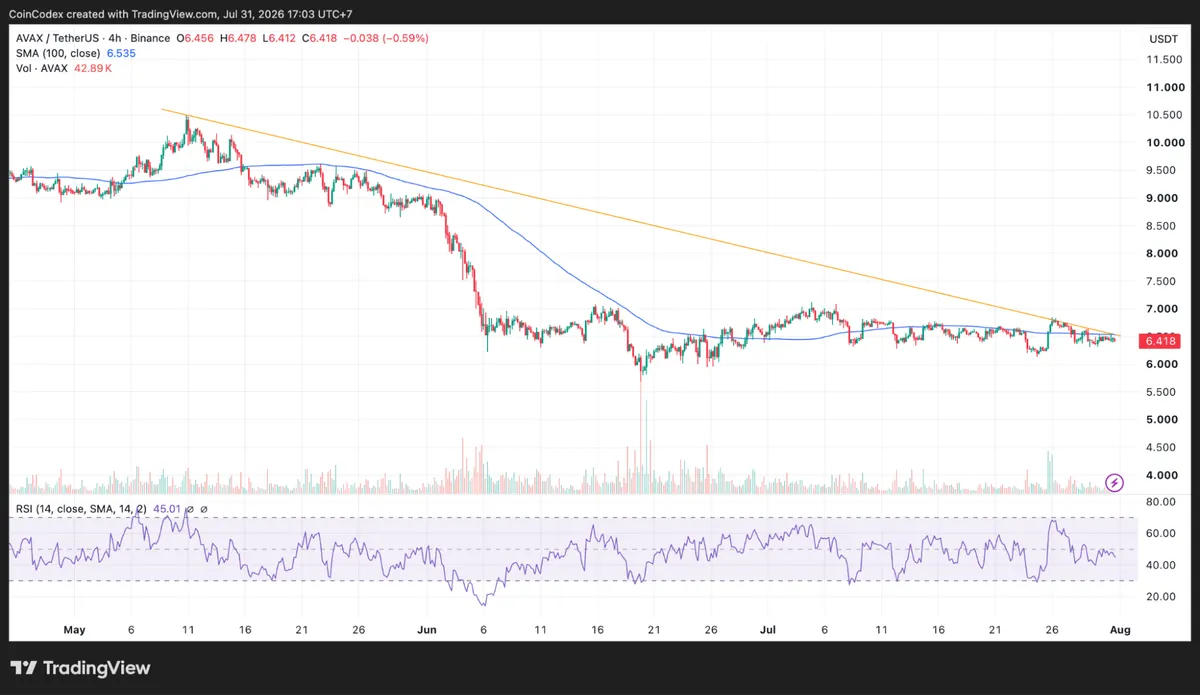
4-hour AVAX chart analysis
Momentum is also weak. The 4-hour RSI is around 45, which is below the neutral 50 level and points to mild bearish pressure. Buyers have not taken control yet, although the market is not deeply oversold either.
The immediate resistance zone is around $6.48-$6.54. A move above that area would bring $7.00 into focus. If the AVAX price gets rejected there, the market could revisit $6.41 and then the more important $6.00 support.
What comes next for AVAX?
For the bullish case to improve meaningfully, the AVAX price needs to reclaim $7.00 and then $10.00. Those are the levels that would start changing the longer-term structure from “downtrend” to “recovery.”
The bearish case remains active as long as AVAX stays below those resistance levels. A decisive break under $6.00 would increase the probability of a move toward $5.00 and potentially $4.00.
According to CoinCodex’s 1-month AVAX price prediction, the price is projected to reach $6.16, indicating relatively limited short-term upside from current levels unless buyers can reclaim the $6.54-$7.00 resistance zone.









