


Key highlights:
- The gold price bounced after the Fed kept rates at 3.50%-3.75%, even as policymakers maintained a tightening bias
- Key technical support is near $4,050, with resistance levels at $4,100 and $4,200
- CoinCodex’s 1-month gold forecast points to $4,311.71 if buyers can hold the current support zone
Gold traders are once again asking whether the market is underestimating how supportive Federal Reserve policy could become. Macro analyst Tavi Costa argued that if this is the “hawkish Fed” investors were promised, a more dovish policy path could be a major tailwind for precious metals.
His comment came as markets continued pricing a surprisingly aggressive path for interest rates. Costa noted that traders were assigning roughly a 65% probability of another rate hike next month and close to a 50% chance of two additional hikes by January.
He believes those odds are too high, and that is the key reason he remains constructive on gold. The market reaction after the latest Fed decision shows why this debate matters.
Gold reacted immediately to the Fed decision
The US Federal Reserve decided to maintain its rate, as the federal funds target range remained steady at 3.50%-3.75%. According to Kitco, the price of gold rose by $40 following the decision as the spot price went past $4,100 briefly.
Gold price jumps as Federal Reserve leaves interest rates unchanged
The gold market is enjoying a modest relief rally after the Federal Reserve left interest rates unchanged; however, the central bank continues to maintain a solid tightening bias.
As expected, the Federal… pic.twitter.com/Owb50pKZ7R— Kitco NEWS (@KitcoNewsNOW) July 29, 2026
The Fed’s decision wasn’t entirely dovish as three policymakers voted to raise the rate by 25 basis points, maintaining the tightening policy bias. Nevertheless, the initial reaction demonstrated that gold traders were happy that the Fed didn’t increase interest rates in this particular meeting.
The immediate takeaway is simple: the gold price is responding much more positively to “no hike” news than many investors expected.
Gold daily and 4-hour charts paint Different pictures
We took a look at the gold chart, and the longer-term picture remains difficult. Gold is currently being traded at around $4,060 after hitting a high of around $5,697 in late 2025. This indicates that the gold price is down by around 28.7% from its high.
The daily chart is displaying lower highs and lower lows, indicating that the overall trend is bearish at the moment. The gold price is currently around 8.3% below the 100-day moving average of around $4,426, and this moving average has been continuously falling.
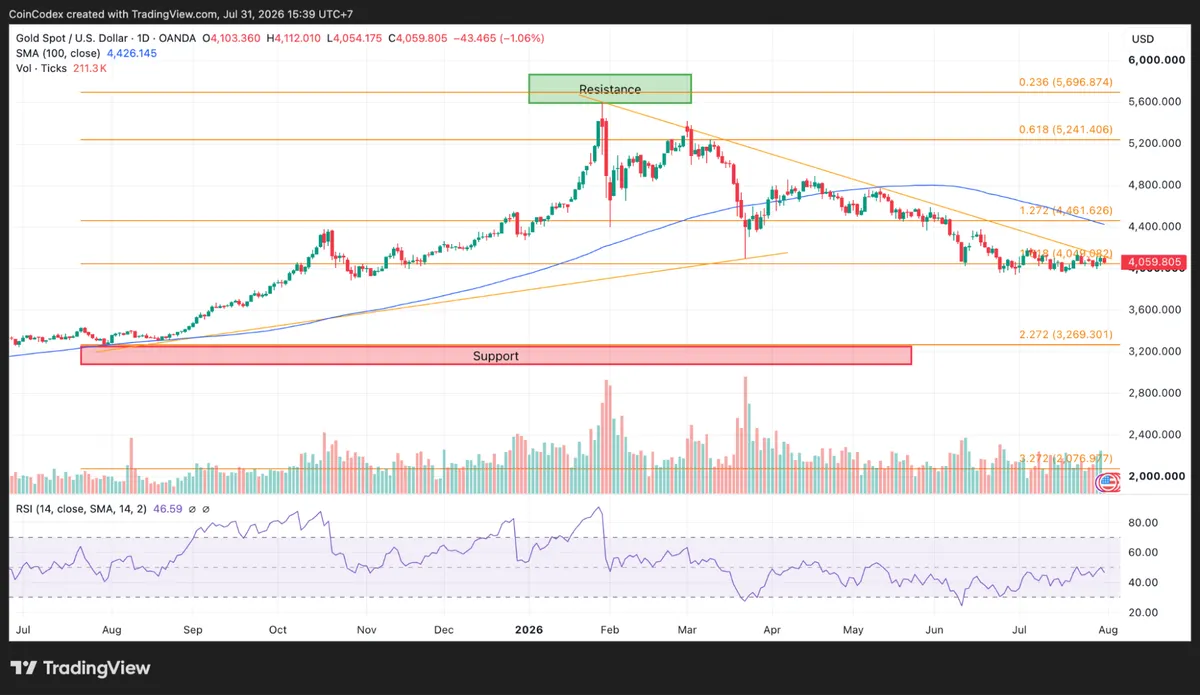
Daily gold chart analysis
The most critical area on the daily chart is the 1.318 Fibonacci level of around $4,050. Gold is being traded right on the 1.318 Fibonacci level. If buyers defend it, the market could attempt a recovery. If it breaks, traders will likely start watching $4,000, then $3,800, and eventually the deeper $3,269 Fibonacci support.
The shorter-term chart is less bearish than the daily trend. Gold is trading almost exactly on its 4-hour 100-period moving average near $4,058. Price has been trapped in a relatively tight range between $4,054 and $4,088.
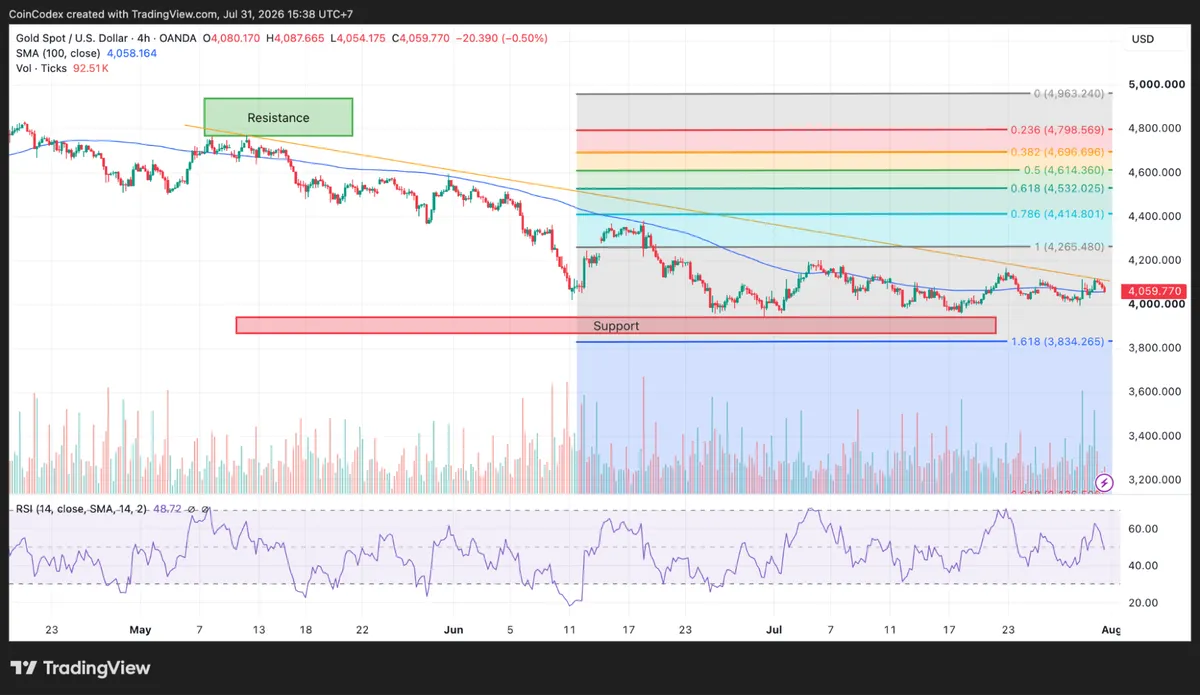
4-hour gold chart analysis
Momentum is close to neutral. RSI on the 4-hour timeframe is approximately 48.7, indicating that the buyers and sellers are more or less in balance in the very short term. Above the resistance level of $4,088, next levels to watch out for are $4,100 and then $4,150. Below the support level of $4,054, $4,050 becomes relevant again.
Why analysts think gold could benefit
Costa’s argument is rooted in interest-rate expectations. Gold generally performs better when investors believe real interest rates are likely to fall. If the market is pricing too many hikes, and the Fed ultimately delivers fewer hikes than expected, gold could benefit from that repricing.
The current setup is unusual because gold has already corrected sharply, yet traders are still pricing a fairly aggressive policy path. Costa believes that mismatch creates room for a positive surprise.
This does not mean the gold price is guaranteed to rally immediately. It means that a softer-than-expected Fed path could become a stronger catalyst than many investors are assuming.
If this is the hawkish Fed we were promised, imagine what a dovish Fed could look like.
Keep in mind:
The market is still pricing in a 65% probability of a rate hike next month and roughly a 50% chance of two hikes by January.
I find that highly unlikely — and a potential… pic.twitter.com/A6PI39RCJC— Otavio (Tavi) Costa (@TaviCosta) July 31, 2026
For the gold price to regain its bullish momentum, the first hurdle is $4,100. Above that, traders will likely focus on $4,200, then the daily moving average near $4,426, and later the $4,462 Fibonacci resistance zone.
The bearish scenario remains active as long as gold stays below those levels. A decisive break under $4,050 would strengthen the case for another leg lower.
One thing that stands out is that the daily RSI is around 46.6, which is below the neutral 50 level but not deeply oversold. That means gold still has room to move in either direction without hitting an extreme momentum condition.
Where could the gold price go next
The chart and the macro backdrop are sending mixed signals. The daily trend is still bearish, but the market is trying to stabilize around a very important support zone. The Fed’s decision not to hike rates produced an immediate positive reaction, and that tells me traders remain highly sensitive to policy expectations.
For August, the chances of the gold price staying within the range of $4,050 and $4,200 look more realistic compared to moving in one direction to the high levels. Moving beyond the level of $4,200 will mark the first strong signal of the start of the recovery process. A move below the level of $4,050 will direct attention back to $4,000.
According to CoinCodex’s 1-month gold price forecast, the gold price is projected to trade around $4,311.71, indicating moderate upside potential from current levels if buyers can defend the $4,050 support zone and push back above $4,200 resistance.
The key question is whether the market is overestimating how hawkish the Fed will be over the next several months. If Costa is right and rate-hike expectations are too aggressive, gold may be much closer to a durable bottom than the current chart alone would indicate.








