



Key highlights:
- The BTC price remains trapped between $63.7K support and $66.5K resistance.
- Morgan Stanley's spot Bitcoin ETF has surpassed $400 million in assets under management.
- CoinCodex projects the BTC price could reach $69,240 over the next month.
Bitcoin has been keeping bulls and bears in frustration for many weeks. The BTC price is currently trading at around $65,016 after recovering from the lows of $63,700; however, bulls have not been able to send the price above the major resistance level of $66,500. Each failed attempt to break out of this range has left traders with their heads down.
The timing is interesting because institutional demand is also improving. Morgan Stanley's spot Bitcoin ETF has already attracted more than $400 million in assets, showing that demand for regulated Bitcoin exposure continues even though the BTC price remains locked in consolidation.
The BTC price is approaching a decision point
Crypto analyst Ardi shared a chart focused on one thing: the range between $63,700 and $66,500. The Bitcoin price bounced off the low of $63.7K to move up to $65,180, resulting in a bounce of about 2.3%. Despite the bounce, buyers have been struggling to move past the upper resistance area.
The chart also labels $63,700 as the daily swing invalidation level. If the BTC price closes below that area, the latest recovery would lose its structure and expose support near $63,000 and then $62,250.
[TWEET]: https://x.com/ArdiNSC/status/2081717382096072840
The reverse situation is equally significant. Any break higher than $66,200 and even $66,500 could open the way for $67,000 and $68,000, with a more comprehensive resistance level existing between the $69K-$70 level.
This is why the range matters. Bulls have failed to break higher several times, and bears have failed to break lower. Every unsuccessful move adds more trapped positions that could fuel a larger breakout once either side finally wins.
Bitcoin still leans bullish in the short-term
The shorter timeframes continue leaning in favor of buyers, although the advantage is not overwhelming. We had a look at the Bitcoin chart on the 4-hour time frame, where the BTC price is at $65,016.
The current BTC price is around $512 above the 100-period SMA at $64,503, or approximately 0.8% higher. The momentum is stable without getting aggressive. This is evident from the 4-hour RSI, which is at 53.44 and slightly above the 50 mark.
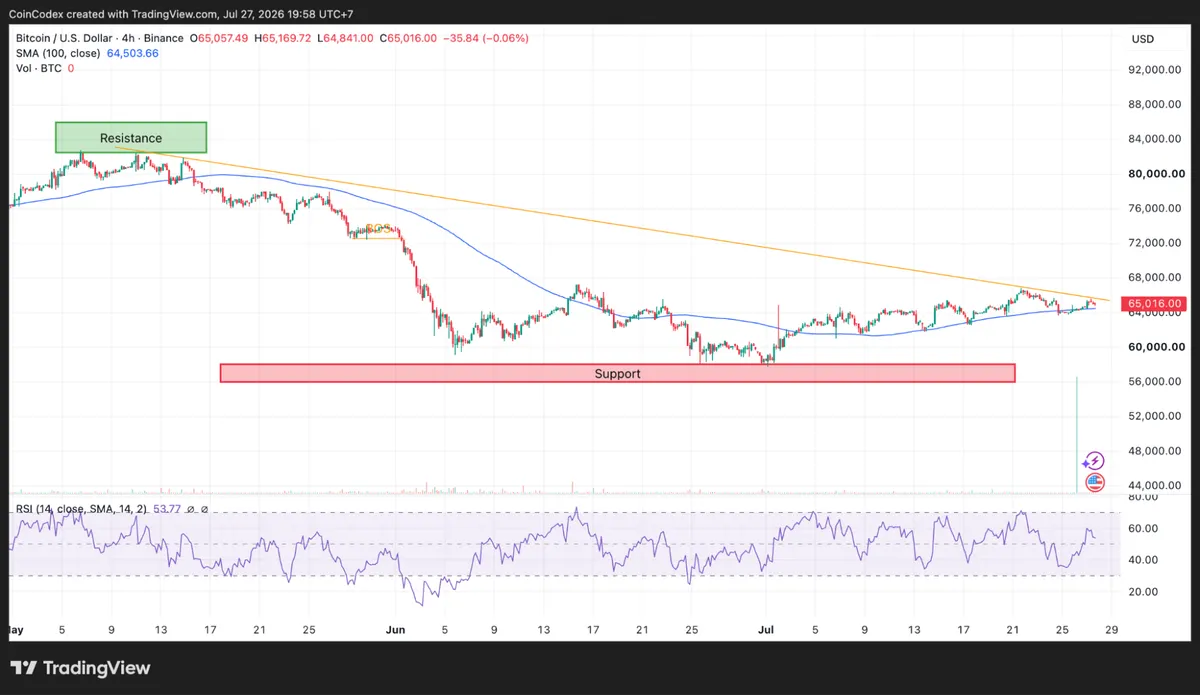
4-Hour BTC chart analysis
The immediate resistance sits near $65,170. Clearing that level would put $65,500 and then $66,200 into view. If buyers lose control, the first important support remains the 100-period SMA around $64,503, followed by the $64,000 area.
The daily trend still needs more work. The general situation is getting better, but there is no completion of the reversal for Bitcoin. Although the price of Bitcoin is higher compared to its low point, it is still 51.3% lower than the high price level of around $133,383 reached in late 2025.
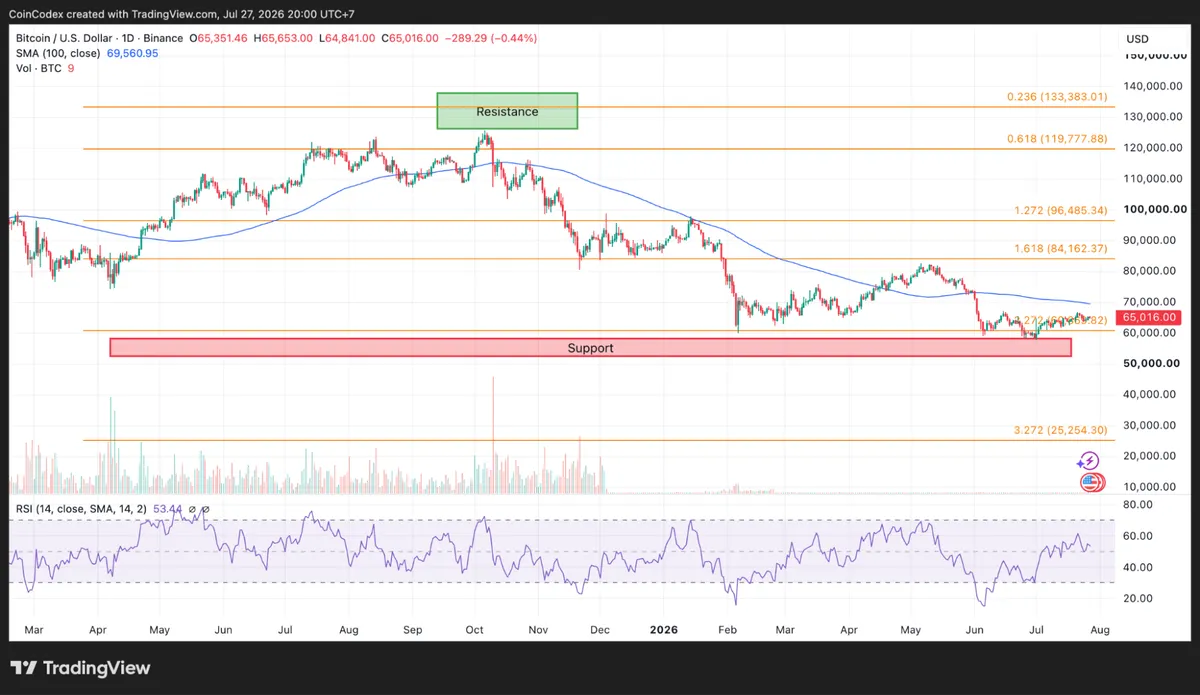
Daily BTC chart analysis
One encouraging signal comes from momentum. The daily RSI has recovered to 53.44 after spending time near oversold conditions earlier this year. Another positive development is the shrinking gap between price and the daily 100-day SMA. That moving average now sits at $69,561, leaving the BTC price about 6.5% below it. Earlier this year, the gap was much wider.
Morgan Stanley's Bitcoin ETF keeps attracting capital
Institutional demand is providing support even though Bitcoin remains range-bound. Morgan Stanley's spot Bitcoin ETF, MSBT, has accumulated more than $400 million in assets since launching in April. About $200 million of that total came from self-directed investors before the firm's financial advisors actively introduced the product to clients.
The ETF also competes on cost. Its sponsor fee is only 0.14%, making it one of the cheapest spot Bitcoin ETFs available. In a market where many funds offer similar exposure, pricing can make a meaningful difference.
The broader U.S. spot Bitcoin ETF market now manages roughly $81.09 billion in assets. Morgan Stanley continues to control only a small share of that sum, but the early numbers reveal that there is solid demand from traditional brokerage customers.
Moreover, Morgan Stanley has also diversified its cryptocurrency offerings via E*TRADE, which currently allows users to trade Bitcoin, Ethereum, and Solana. Plans for self-custody and crypto transfers could further strengthen client participation over time.
On-chain data also fits the consolidation story
According to Glassnode, Bitcoin’s market cap fluctuates within the range of about $1.29 trillion and $1.33 trillion throughout the measurement period. This indicates that money has been steady instead of rushing into and out of the cryptocurrency.
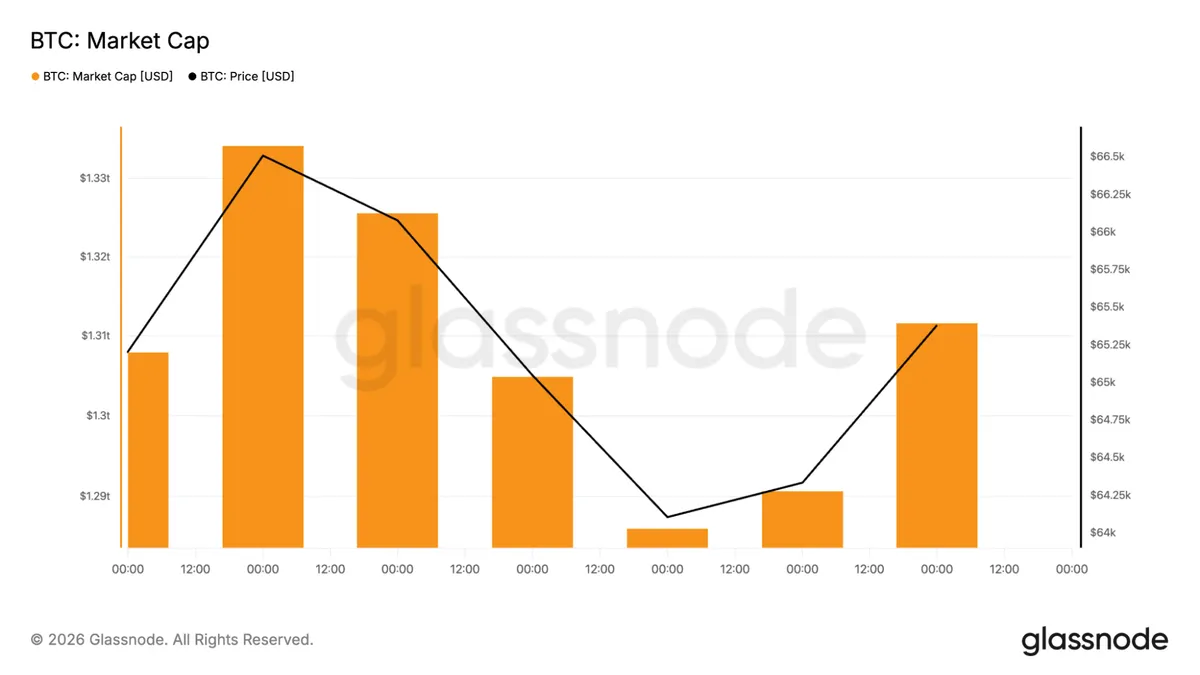
It should be noted that Bitcoin's market capitalization stood at about $2.5 trillion in the previous bull run. In spite of the fact that the market is far from that point, having stability in terms of $1.3 trillion provides good support for the BTC price.
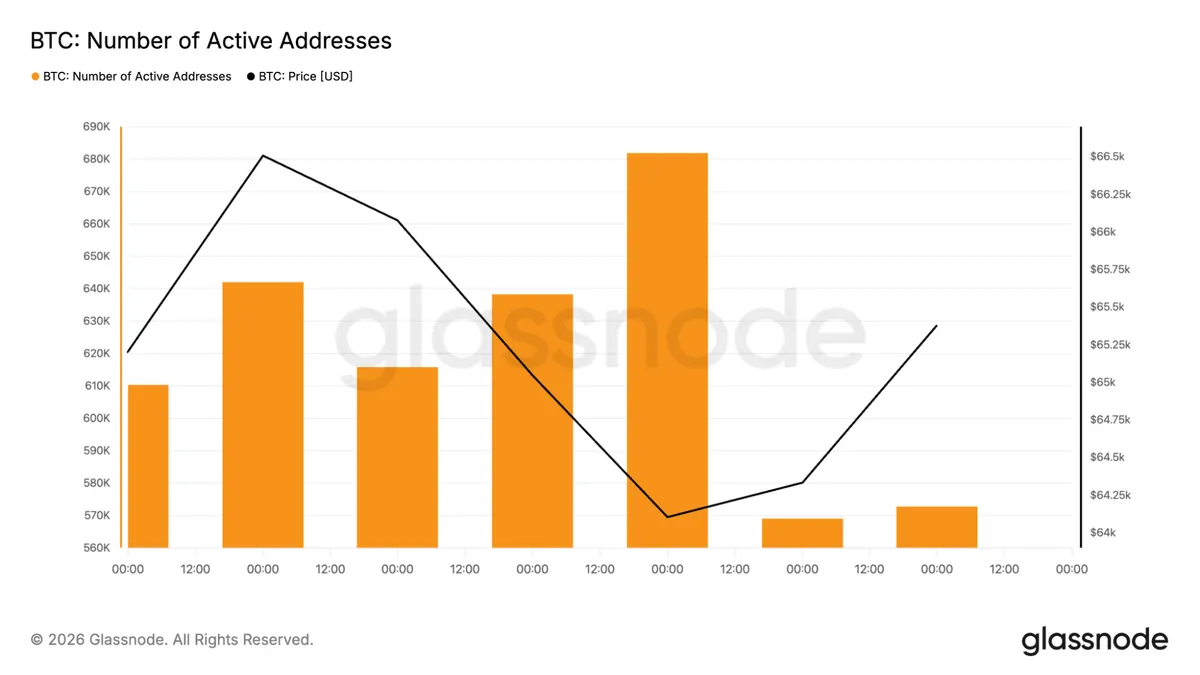
The active-address chart from the same dataset contains rendering issues, making it unsuitable for reliable network analysis. The market-cap figures, however, still provide a useful picture of capital remaining relatively steady.
What comes next for the BTC price?
The BTC price is coming up close to the point where the future direction will be determined. Assuming that the buyers are able to defend $63,700, the BTC price has a second chance to test $66,200 and then $66,500. In case of a breakout from this area, the short sellers will get squeezed.
If sellers push the BTC price below $63,700, the recent recovery would lose momentum, placing $63,000 and $62,250 back into focus. According to CoinCodex's 1-month BTC price forecast, the price is predicted to reach $69,240, indicating modest upside potential from current levels.









