



Key highlights:
- The ETH price is holding above the key $1,850 support as buyers target a move toward $2,060.
- U.S. spot Ethereum ETFs have recorded four straight days of net inflows, led by BlackRock and Fidelity.
- The ETH price remains below its 100-day SMA, leaving $1,971 and $2,000 as the next major hurdles.
Ethereum is now beginning to show some signs of stabilization despite several weeks of bearish momentum. The ETH price is currently trading at $1,891 after bouncing from the $1,850 support level, which is a chance for the buyers to regain their dominant positions.
However, this development does not mean that the cryptocurrency is far away from reversing the downtrend because Ethereum is 63.3% down from its 2025 peak of $5,146.85. In contrast, the U.S. spot Ethereum ETFs are again showing positive cash flows after some weeks of negative cash flows.
The ETH price is holding a key support level
Ali Martinez believes Ethereum is sitting at one of its most important technical levels this month. His 1-hour chart shows the ETH price bouncing after testing the lower boundary of a descending channel, with $1,850 continuing to act as the level buyers need to defend.
Ethereum $ETH has rebounded after testing the lower boundary of its channel.
As long as this support at $1,850 continues to hold, I'm watching for a move back toward the upper boundary near $2,060. pic.twitter.com/3H29SDOprG— Ali Charts (@alicharts) July 24, 2026
We analyzed the chart, and the setup is easily noticeable. The ETH price was quoted at $2,060 early December and dropped to $1,885, indicating a fall of 8.5%. The bullish waves during the decline were accompanied by selling forces, thus resulting in lower highs and lows.
This time is different since the bulls bought the pullback before the ETH price fell to $1,850. As long as the $1,850 level holds, the nearest target for the bulls is $1,980 and then the upper channel boundary at $2,060. In case of failure to hold the support level, the following key level would be $1,800.
The daily chart indicates another attempt from Ethereum to get its act together. The ETH price stands at $1,891.04, making it trade 4.1% below the 100-day simple moving average of $1,971.05. The distance between them has been narrowing over the last few weeks.
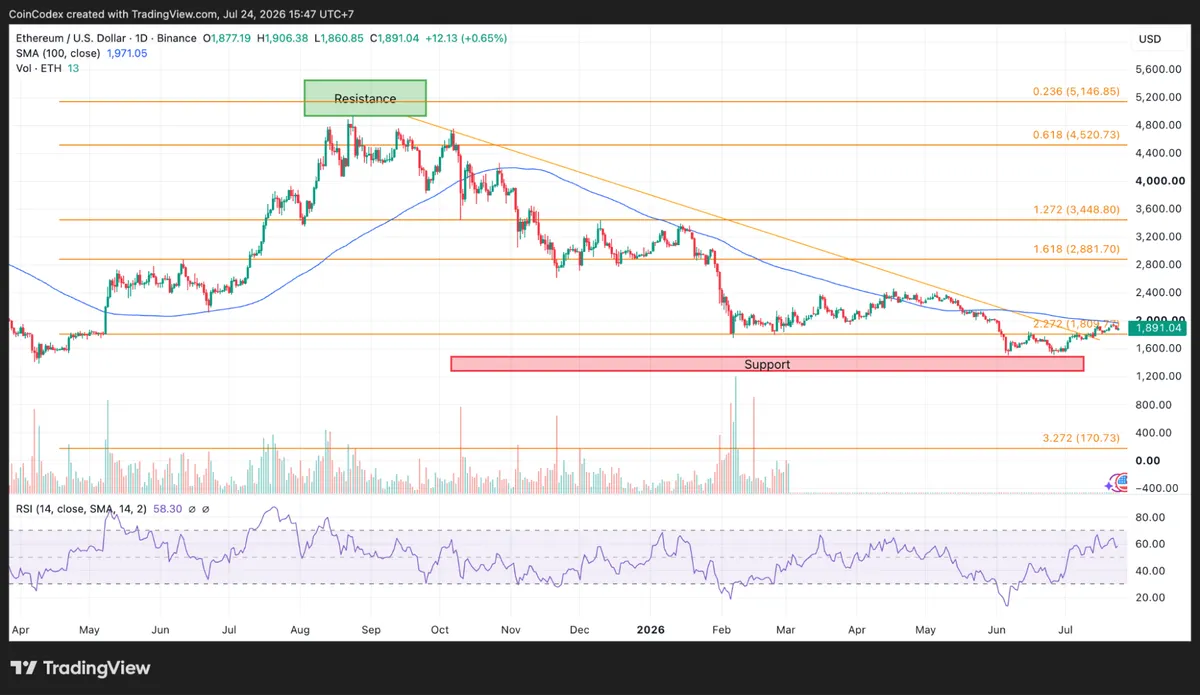
Daily ETH chart analysis
Momentum has also improved. The daily RSI has climbed to 58.30 after recovering from oversold levels earlier this year. It has also continued making higher lows even as price created lower lows during the broader correction, creating a bullish divergence that often appears before larger recoveries.
Ethereum ETF demand has started improving again
Institutional investors are also returning to Ethereum. U.S. spot Ethereum ETFs have ended a multi-week stretch of net outflows. The products brought in approximately $72.64 million in net inflows on July 22, led by BlackRock's ETHA with $53.47 million and Fidelity's FETH with another $19.18 million. None of the spot Ethereum ETFs recorded net outflows that day.
That marked at least four straight sessions of positive flows totaling about $184.93 million. Reports also place total inflows this month above $380 million, showing demand has improved after an extended period of weaker sentiment.
The size of those holdings also matters. Ethereum-based ETFs have now invested $10.6 billion in Ethereum, which constitutes a significant portion of the circulating supply of Ethereum tokens. With these inflows continuing, there will be a smaller number of Ethereum tokens available in the public market.
The next thing worth watching is whether more ETF issuers begin attracting new money. For now, BlackRock and Fidelity account for most of the recent inflows.
On-chain activity paints a mixed picture
Mixed signals emerge regarding the Ethereum Blockchain. According to data provided by Glassnode, there has been a decrease in daily transactions on Ethereum from about 2.8 million to 1.6 million, resulting in about 42.9% reduction. That points to lower network activity over the short term.
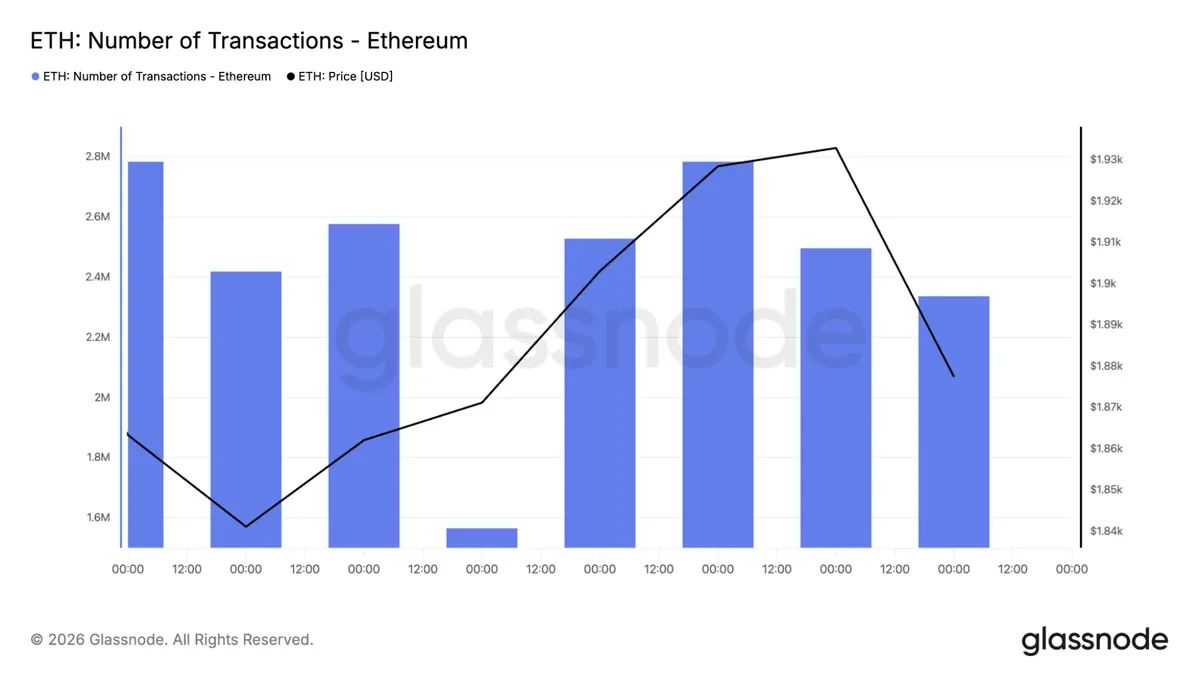
The active address chart also softened after an early spike, although the figures displayed appear lower than Ethereum's normal activity levels, indicating a scaling issue with the visualization. Even so, the overall direction still points to reduced activity during the sample period.
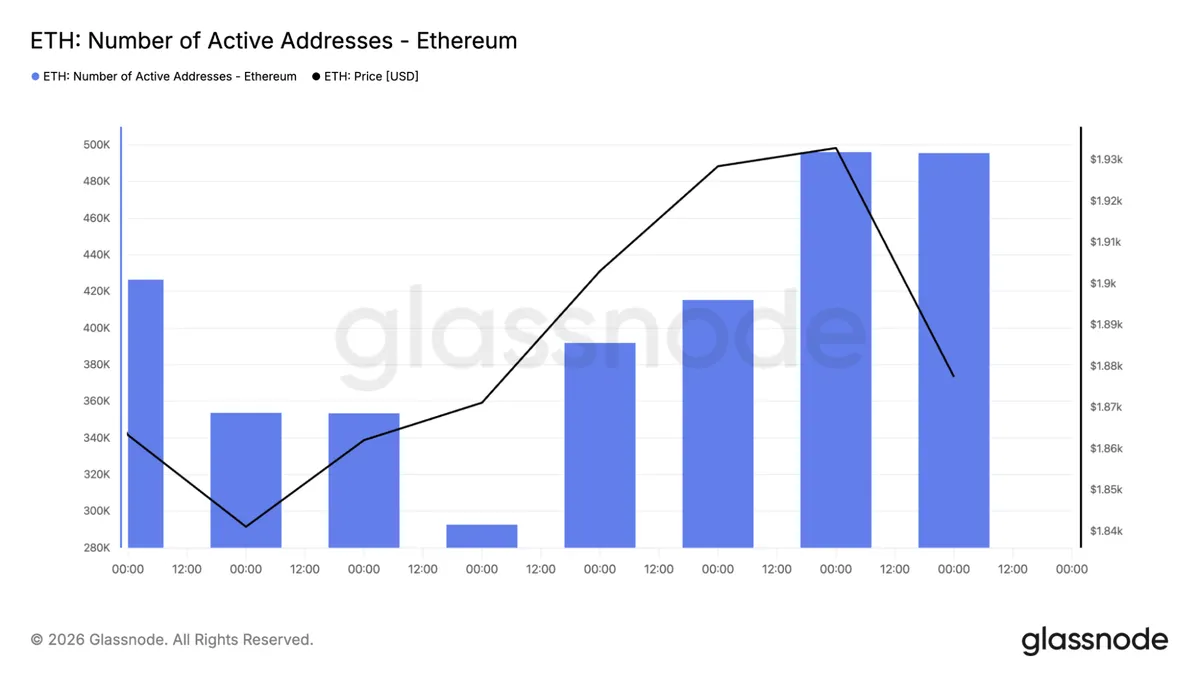
Lower transaction activity does not necessarily mean the ETH price has to move lower. ETF inflows, whale accumulation, and exchange balances continue influencing price action alongside on-chain usage. Even so, stronger transaction growth would provide another sign that demand is improving across the network.
Ethereum short-term momentum is still favoring buyers
The lower timeframes continue leaning in the bulls' favor. We had a look at the Ethereum chart on the four-hour timeframe, where the ETH price remains above the 100-period simple moving average at $1,843.35. Trading around $1,891 leaves Ethereum roughly 2.6% above that trend indicator, showing buyers still control the short-term structure.
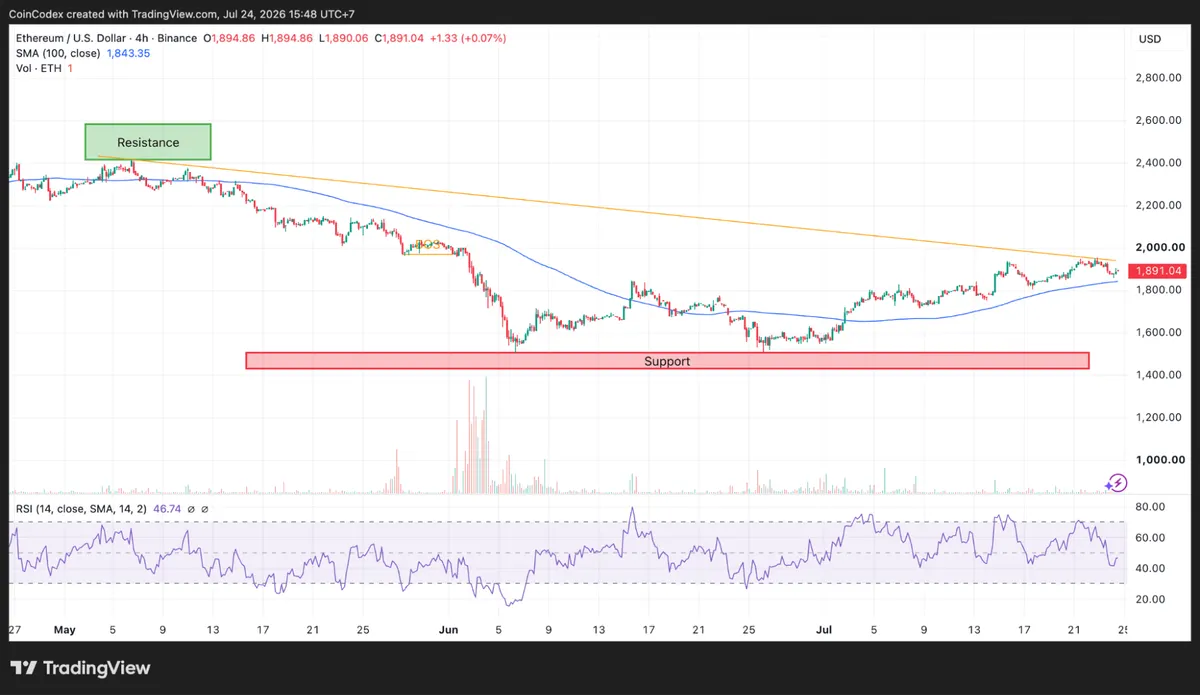
The momentum has slightly slowed but not broken the pattern yet. The 4-hour RSI is at 46.74, below the neutral 50 but higher than some values it was recording this month. This signals consolidation rather than an active bearish sentiment.
Resistance levels start from $1,894.86 and then $1,900 (psychological level). In case buyers are successful in breaking above these levels, next resistance will be seen at $2,000, with the daily SMA at $1,971. On the downside, the first support remains the four-hour SMA near $1,843 before the market reaches the more important $1,800 zone.
What comes next for the ETH price?
The ETH price has reached an area that could decide the next move. Buyers have defended the $1,850 support level, and Ali believes that keeps the door open for a move back toward $2,060 if Ethereum continues holding above the lower boundary of the channel.
ETH price breaking $1,980 followed by breaking $2,000 may push the bounce toward the $2,060 area which Ali is eyeing as the target for this move. Otherwise, the loss of $1,850 will have the focus return to $1,800 level.
Institutional demand has also improved at an important time. Spot Ethereum ETFs have returned to consistent inflows, adding more than $184 million across four consecutive sessions and lifting total ETF holdings to approximately $10.6 billion.
According to CoinCodex’s 1-month ETH price forecast, the price is predicted to be $1,808.79, indicating modest downside risk from current levels unless the ETH price can reclaim the $1,971 100-day moving average and break above the $2,000-$2,060 resistance zone.









