



Key highlights:
- The SOL price remains below key moving averages, with resistance at $79.84 and $85
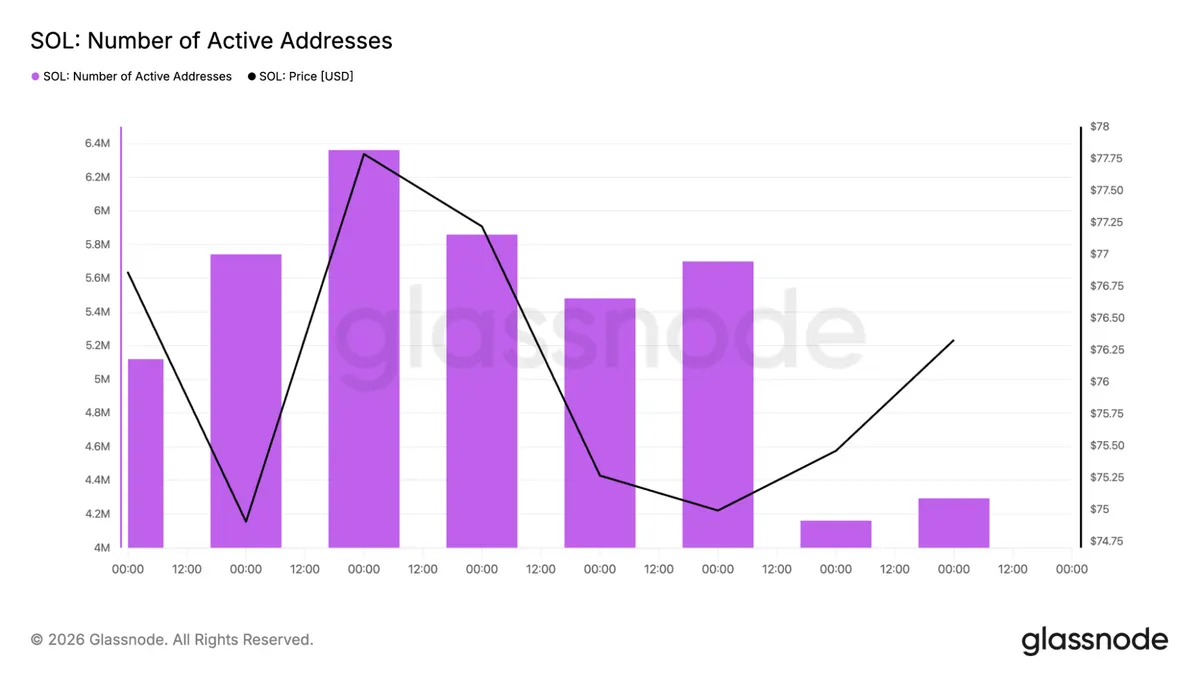
- Solana continues recording 4–6.4 million daily active addresses and up to 56 million daily transfers
- SBI Holdings plans a 3% yield yen-backed stablecoin platform on Solana, boosting the network's institutional adoption
Solana has spent much of 2026 moving lower, losing more than 72% from its late-2025 peak. Even so, not everyone believes the downside has much room left. Some analysts think SOL is trading in a price range that has historically offered very little resistance once buyers regain control.
Away from the charts, Solana continues finding new institutional use cases. Japan's SBI Holdings is preparing a yen-backed stablecoin lending platform and tokenization services on Solana, giving the network another foothold in regulated finance.
The SOL price is trading in a key zone
Crypto analyst Gum's analysis focuses on one simple observation. During the previous bull market, the SOL price climbed from about $75 to $140 with very little resistance. During the correction, the market fell through the same range just as quickly.
That leaves what traders often call an imbalance, an area where price spent very little time. In Gum's view, if the SOL price can climb back above $125, there is relatively little technical resistance until the market reaches the yearly open near $143.
$SOL
> Up only from $75 to $140 last cycle
> Down only from $140 to $75 this cycle
Both times this range offered no resistance/support leaving a really large imbalance area
There is no resistance until $125 which even at this current price is a 64% gain
Flip $125 and imagine… pic.twitter.com/Ewpxe5g0HR— gum (@gumsays) July 19, 2026
On the weekly chart, the overall bias remains bearish. The SOL price is trading at $76.23, down by 74.6% from its top at $300. Moreover, the current price is below all major weekly exponential moving averages. These levels are the 20-week EMA at $85.30, the 50-week EMA at $110.68, the 100-week EMA at $124.65, and the 200-week EMA at $110.74.
These levels will act as resistance to SOL. The first resistance level stands at $85.30. Breaking above this level, the next key resistance area will be between $110-$125, where we could see talks of $143. Support is seen at $75.64. Below this level, we see $70, $60, and then $50 as key levels.
Solana bulls are fighting to reclaim control
The shorter timeframes look more balanced than the weekly chart. We analysed the SOL 4-hour chart, which shows that the SOL price is trading at $76.33, barely 2.1% lower than the 100-period simple moving average of $77.94. The 4-hour RSI is now at 53.75, which means that momentum has risen above neutral after weeks below.
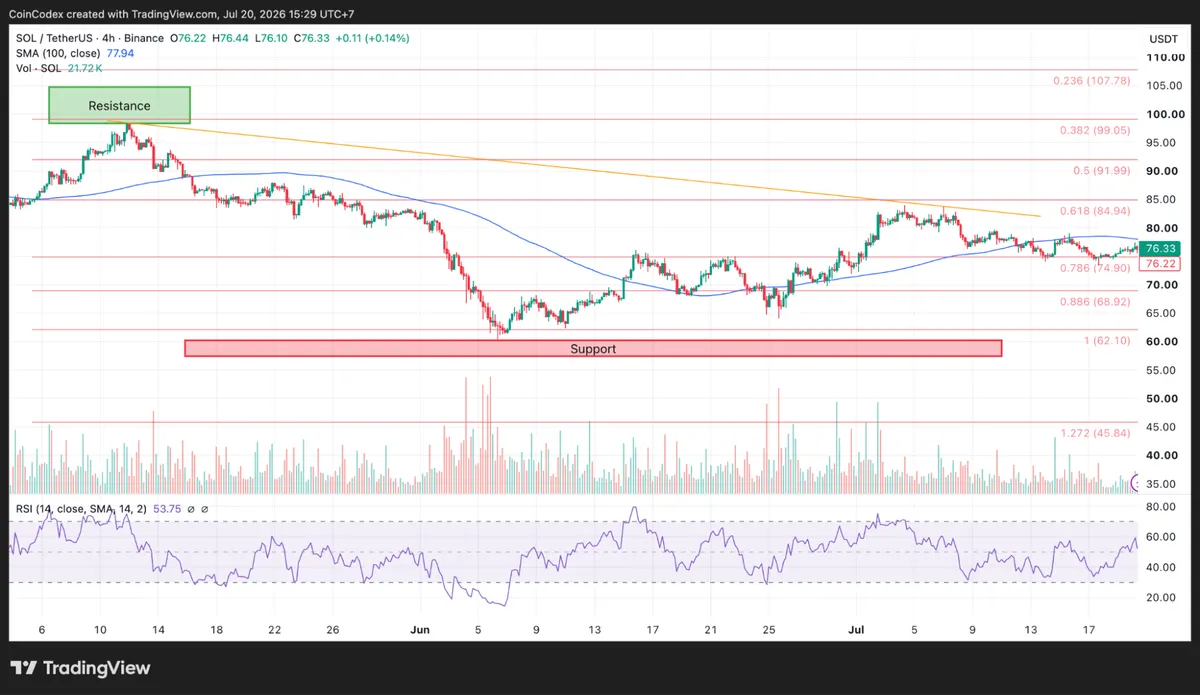
4-hour SOL chart analysis
That means buyers have a clear objective. A move above the 100-period moving average would open the door to $80 and then $85. There is also an indication on the daily chart that selling pressure has been reduced. The SOL price is at $76.29, which represents a decrease of 4.4% from the 100-day SMA level of $79.84.
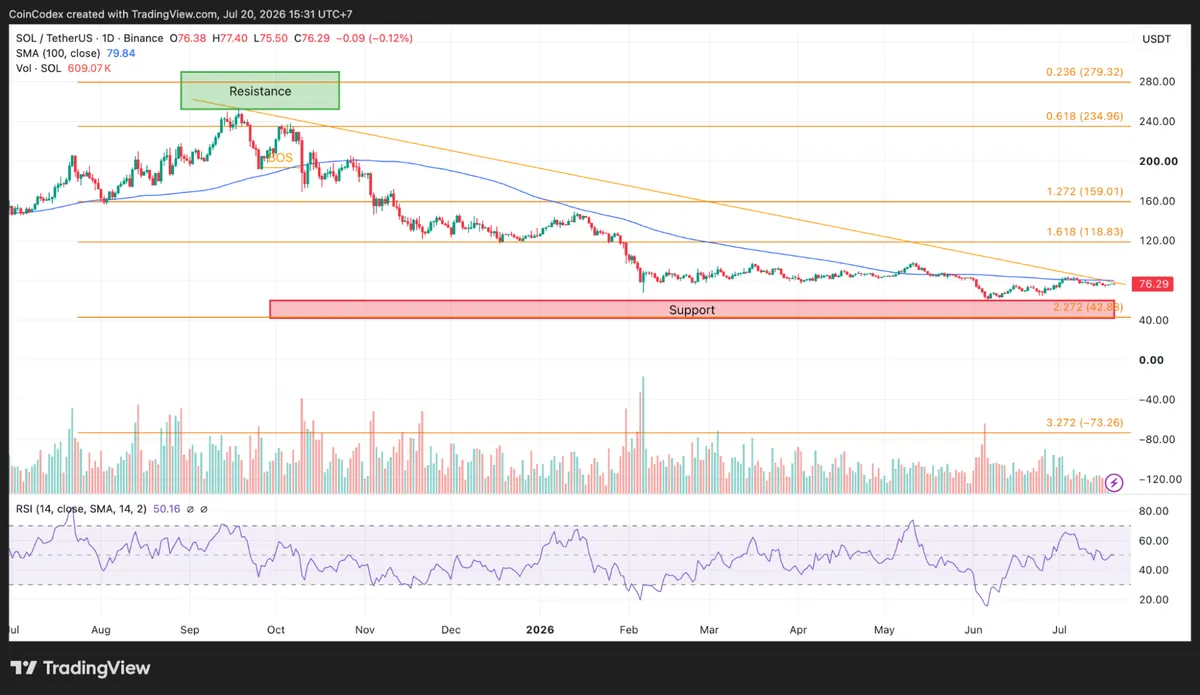
Daily SOL chart analysis
The daily RSI has also recovered to 50.16 levels after being much weaker early this year. This is another good signal. The RSI continues to record higher lows despite the fact that prices have been printing lower lows during the correction process. This is usually a positive divergence, indicating that selling momentum may be slowing down.
Solana's blockchain remains extremely busy
Price has weakened, but network activity has not followed the same path. Daily active addresses continue fluctuating between roughly 4 million and 6.4 million wallets. That remains one of the highest activity levels across major blockchains.
Transaction activity is equally impressive. Solana has processed as many as 56 million daily transfers during the measured period. Even with the SOL price trading well below last year's highs, network usage has stayed exceptionally strong.
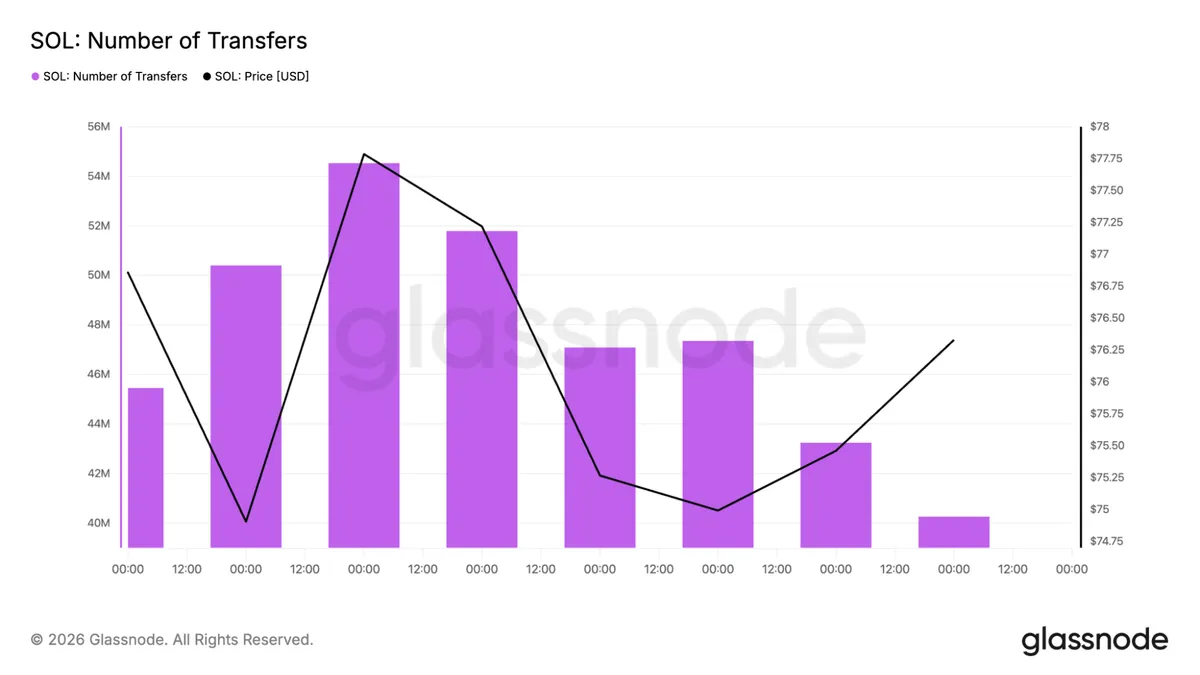
That disconnect between price and usage is worth watching. High activity alone does not guarantee a higher valuation because some transactions come from automated applications and low-cost transfers. Still, sustained network usage at this scale gives Solana one of the strongest fundamental backdrops among large blockchain networks.
SBI is bringing another institutional use case to Solana
Outside the technical picture, Solana continues expanding inside traditional finance. Japan's SBI Holdings plans to launch a yen-denominated stablecoin lending platform on Solana that targets approximately 3% annual yield. The company also intends to introduce tokenization services for Japanese financial assets using Solana's infrastructure.
This is more than another blockchain partnership. SBI is one of Japan's largest financial groups, and the platform is designed for a regulated market where compliance requirements are among the strictest in the world.
The project will also improve Solana's standing in the realm of stablecoins and real-world tokenized assets. The Solana network currently hosts billions of dollars worth of liquidity in the stablecoin market, while SBI's project can attract more institutional liquidity on Solana provided that there is sufficient adoption.
The future key milestones to track are the release of the lending platform, the development of liquidity in the yen-based stablecoin market, Japanese regulations, and whether other financial institutions join SBI in its efforts.
What comes next for the SOL price?
The SOL price is at technical levels where its future performance will be determined. This can be seen through the 4-hour SMA at $77.94 and daily SMA at $79.84. If SOL breaks past these two levels, then the targets will be seen at $85 and $90. Further above are the resistance areas at $110-$125.
That $125 level remains the one Gum is watching most closely. If buyers can reclaim it, the next major resistance comes near the yearly open around $143.44. If sellers remain in control, support stays around $75.64, followed by $70 and $60.
Fundamentally, Solana continues posting some of the strongest network activity in crypto, with between 4 million and 6.4 million daily active addresses and up to 56 million transfers processed per day. At the same time, SBI's stablecoin lending initiative gives the network another institutional use case that extends beyond crypto trading.
According to CoinCodex's 1-month SOL price prediction, the price is projected to reach $102.49, implying upside from current levels if the SOL price can break above the $79.84 resistance and reclaim the 100-day moving average before challenging the psychological $100 level.









