



Key highlights:
- The DOGE price is testing key resistance after softer U.S. inflation lifted crypto markets
- Technical analysis shows weakening bearish momentum as traders watch the $0.080 and $0.092 resistance levels
- On-chain activity is weak, with daily active Dogecoin addresses dropping nearly 16%
Dogecoin seems to be reviving from its dormant state for many months now, but the overall trend remains unchanged. An unexpected U.S. inflation report boosted the cryptocurrency market, allowing DOGE to follow the upward move alongside Bitcoin, Ethereum, and others.
Crypto analyst More Crypto Online believes Dogecoin could be nearing the end of its multi-year correction. Even so, he believes there is still room for one more move lower before the correction is fully complete.
This means that investors are looking out for several major resistance zones where the DOGE price could potentially start recovering. On the other hand, data from the on-chain sector paints a more conservative picture. The level of wallet activity has fallen despite the stabilization of the DOGE price.
The DOGE price is approaching an important technical level
More Crypto Online's analysis focuses on Dogecoin's weekly Elliott Wave structure. After reaching an all-time high near $0.74 during the previous bull market, the DOGE price entered a long corrective phase that has brought it back to the $0.07 area.
The analyst believes that correction could be entering its final stages. Even so, he is not ruling out one more short-term dip before the market establishes a more durable bottom. We had a look at the weekly DOGE chart, and the Fibonacci levels support that outlook.
Dogecoin was supposed to be a joke.
Yet if you bought $DOGE at its $0.74 all-time high, your $10,000 investment would still be worth roughly $1,000 today.
That's painful.
But here's the surprising part:
DOGE has outperformed many projects that claimed to have superior… pic.twitter.com/DmPbYk4Tol— More Crypto Online (@Morecryptoonl) July 16, 2026
The first major resistance sits at $0.1220, followed by $0.1454 and then $0.1734. If buyers can reclaim those levels, the broader technical picture would begin to improve. On the downside, support remains around the present trading range. If sellers break below that zone, the next Fibonacci support levels come in near $0.0306 and then $0.0142.
The weekly chart is based entirely on price structure, Elliott Wave counts and Fibonacci retracement levels, so there are no moving averages or RSI readings to help confirm momentum.
Dogecoin short-term momentum is beginning to improve
The daily chart still favors the bears overall. The DOGE price is currently trading at $0.07395, about 20% below the 100-day simple moving average at $0.09222. The price has been consistently below the moving average since early 2026, and the moving average is still trending downward.
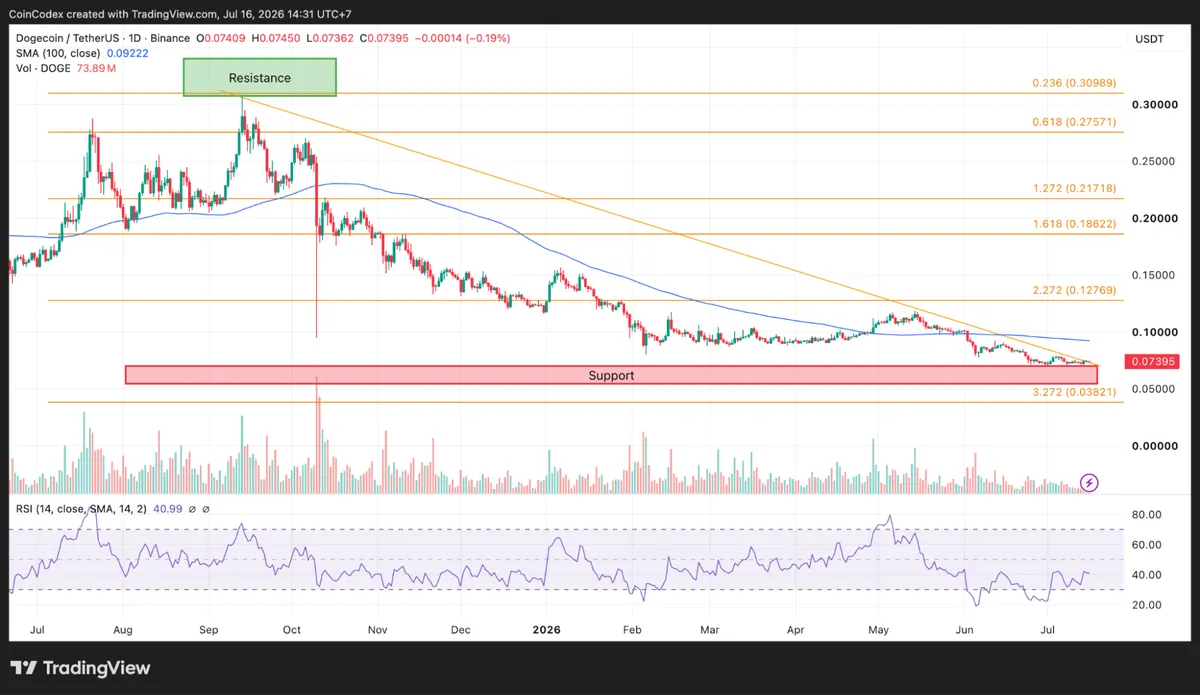
Daily DOGE chart analysis
One indicator is encouraging. The daily RSI has climbed to 40.99 after forming higher lows even though the DOGE price continued making lower lows. That bullish divergence often appears when selling pressure begins to ease. It is not a confirmation that a reversal has started, but it does show that bearish momentum is weakening.
The shorter-term chart paints a more balanced picture. We had a look at the 4-hour DOGE chart, where the DOGE price is trading only about 0.3% below the 100-period simple moving average at $0.07415.
The 4-hour RSI has increased to 53.04, meaning that momentum is slightly higher than the 50 neutral mark. Trading is now between the $0.07377 and $0.07436 levels, forming a narrow trading range.
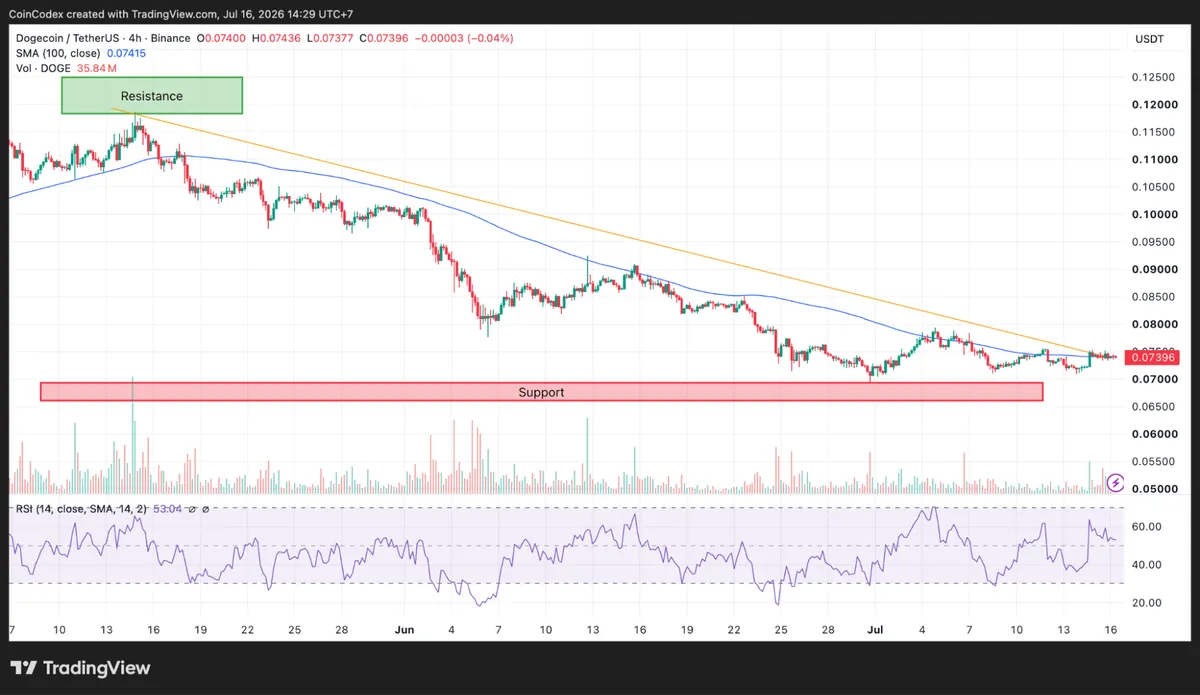
4-hour DOGE chart analysis
If the buyers manage to break $0.07436 level, the next price targets will be $0.07500 and $0.08000. In case the sellers dominate on the market, price supports will be at $0.07300 and $0.07000. In general, short-term charts look positive but the downtrend remains intact.
Softer inflation helped lift the DOGE price
This time around, the move upwards has been influenced more by macroeconomic events rather than anything specific to Dogecoin. The U.S. inflation data released in June was lighter-than-expected, lowering fears about the need for the Fed to keep rates high for a prolonged period of time.
This contributed to a better sentiment in financial markets and resulted in money flowing back into the crypto space. Bitcoin managed to reach the $65,000 region, Ethereum approached the $1,880 level, and the DOGE coin surged by 3% during the same relief rally.
Dogecoin is currently being traded at $0.074 with a market capitalization of $11.49 billion and a daily trading volume of $634.6 million. High liquidity in Dogecoin makes it susceptible to respond positively to positive shifts in market sentiment.
The future developments in terms of inflation reports and decisions by the Fed will be crucial factors. In case of declining inflation figures, the risk markets can see further gains. Rising inflation will bring pressure on recent gains.
Network activity remains weak
Even though the DOGE price is steady, the on-chain activity is moving in the other direction. There has been a decrease of about 15.9% in the daily active addresses, which have declined from about 44,000 to 37,000.
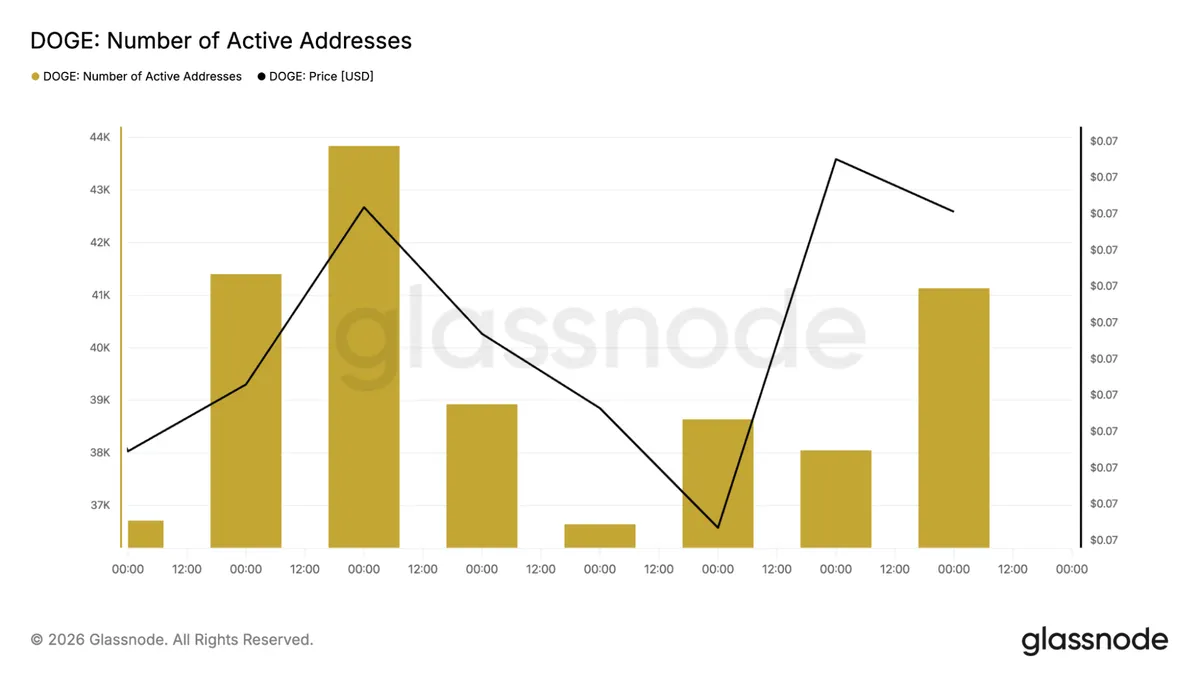
The daily transactions have risen from about 55,000 to more than 61,000 transactions, which was the highest recorded in the observed period. This rise in transaction volume was seen after DOGE started to stabilize in terms of price, implying that there are more people transacting with DOGE.
In general, increased network activity leads to positive price movements due to high transactions on the blockchain. In this case, the DOGE price remained relatively stable even as fewer wallets were active.
What comes next for the DOGE price?
The DOGE price is approaching an important decision point. Support will be found near $0.07436, $0.07500, and then $0.08000. If buyers decide to extend their upward movement, they should watch out for the daily 100-day moving average at $0.09222.
From a long-term perspective, it appears that the weekly Fibonacci resistance range of $0.1220 and $0.1734 could prove to be more difficult. Breaking above that range would increase the possibility that the multi-year correction is over.
On the downside, support remains around $0.07377, followed by $0.07000. If those levels fail, the longer-term Fibonacci support levels near $0.0306 and $0.0142 become the next areas to watch.
CoinCodex's 1-month DOGE price prediction places the price at $0.07858, implying modest upside from current levels if the DOGE price can hold above the $0.070 support area and break through the immediate resistance at $0.080.









