



Key highlights:
- The PI price remains in a downtrend, though oversold RSI readings hint that selling pressure may be easing
- Pi Network expanded Pi App Studio with new AI tools and code upload/download features to support app development
- CoinCodex's 1-month forecast sees the PI price at $0.05857, unless buyers reclaim the $0.10 resistance level
PI Network has had a difficult few months. Following a fall of almost 62% since hitting its April peak around $0.20, the coin is attempting to consolidate itself after yet another bout of significant selling pressure.
According to crypto analyst Kim H. Wong, the PI price fell to $0.07561 after a 20% daily fall in price, while the trading volume surged by nearly 277%. Even though the charts continue to point to a downtrend, there are already some improvements taking place regarding technical indicators.
Meanwhile, Pi Network continues to develop its network, launching AI-based tools in Pi App Studio.
The PI price is trying to find support
According to Kim H. Wong, this recent sell-off requires serious consideration due to the exceptional rise in the number of trades. PI is trading at around 62% down from the April highs of $0.20 to $0.07561, while daily trading volumes have risen by approximately 280% to $34 million.
$Pi, after dropping 62% to $0.07561 from April high of around $0.20, today's single day drop of 20% on 277% volume increase with no news, selling exhaustion may be near.$Pi 币已从 4 月份约 0.20 美元的高点下跌 62% 至 0.07561 美元;今日在无任何消息面的情况下,该币种单日下跌… pic.twitter.com/xKtZQ3Wb4Q
— Kim H Wong (@Time_and_Trade) July 13, 2026
Heavy volume during a selloff often means sellers are rushing to exit positions. Since there was no major announcement behind the move, Wong believes the market may be getting closer to selling exhaustion.
That doesn't mean the trend has changed. The PI price continues to print lower highs and lower lows, keeping the broader bearish structure intact. Buyers still need to reclaim $0.10 before attention turns to $0.12 and $0.14.
A move above $0.16 would be the first stronger sign that the longer-term downtrend is beginning to fade. If sellers remain in control, the next support levels come in around $0.075, followed by $0.07 and then $0.06.
The Pi Network technical picture is still mixed
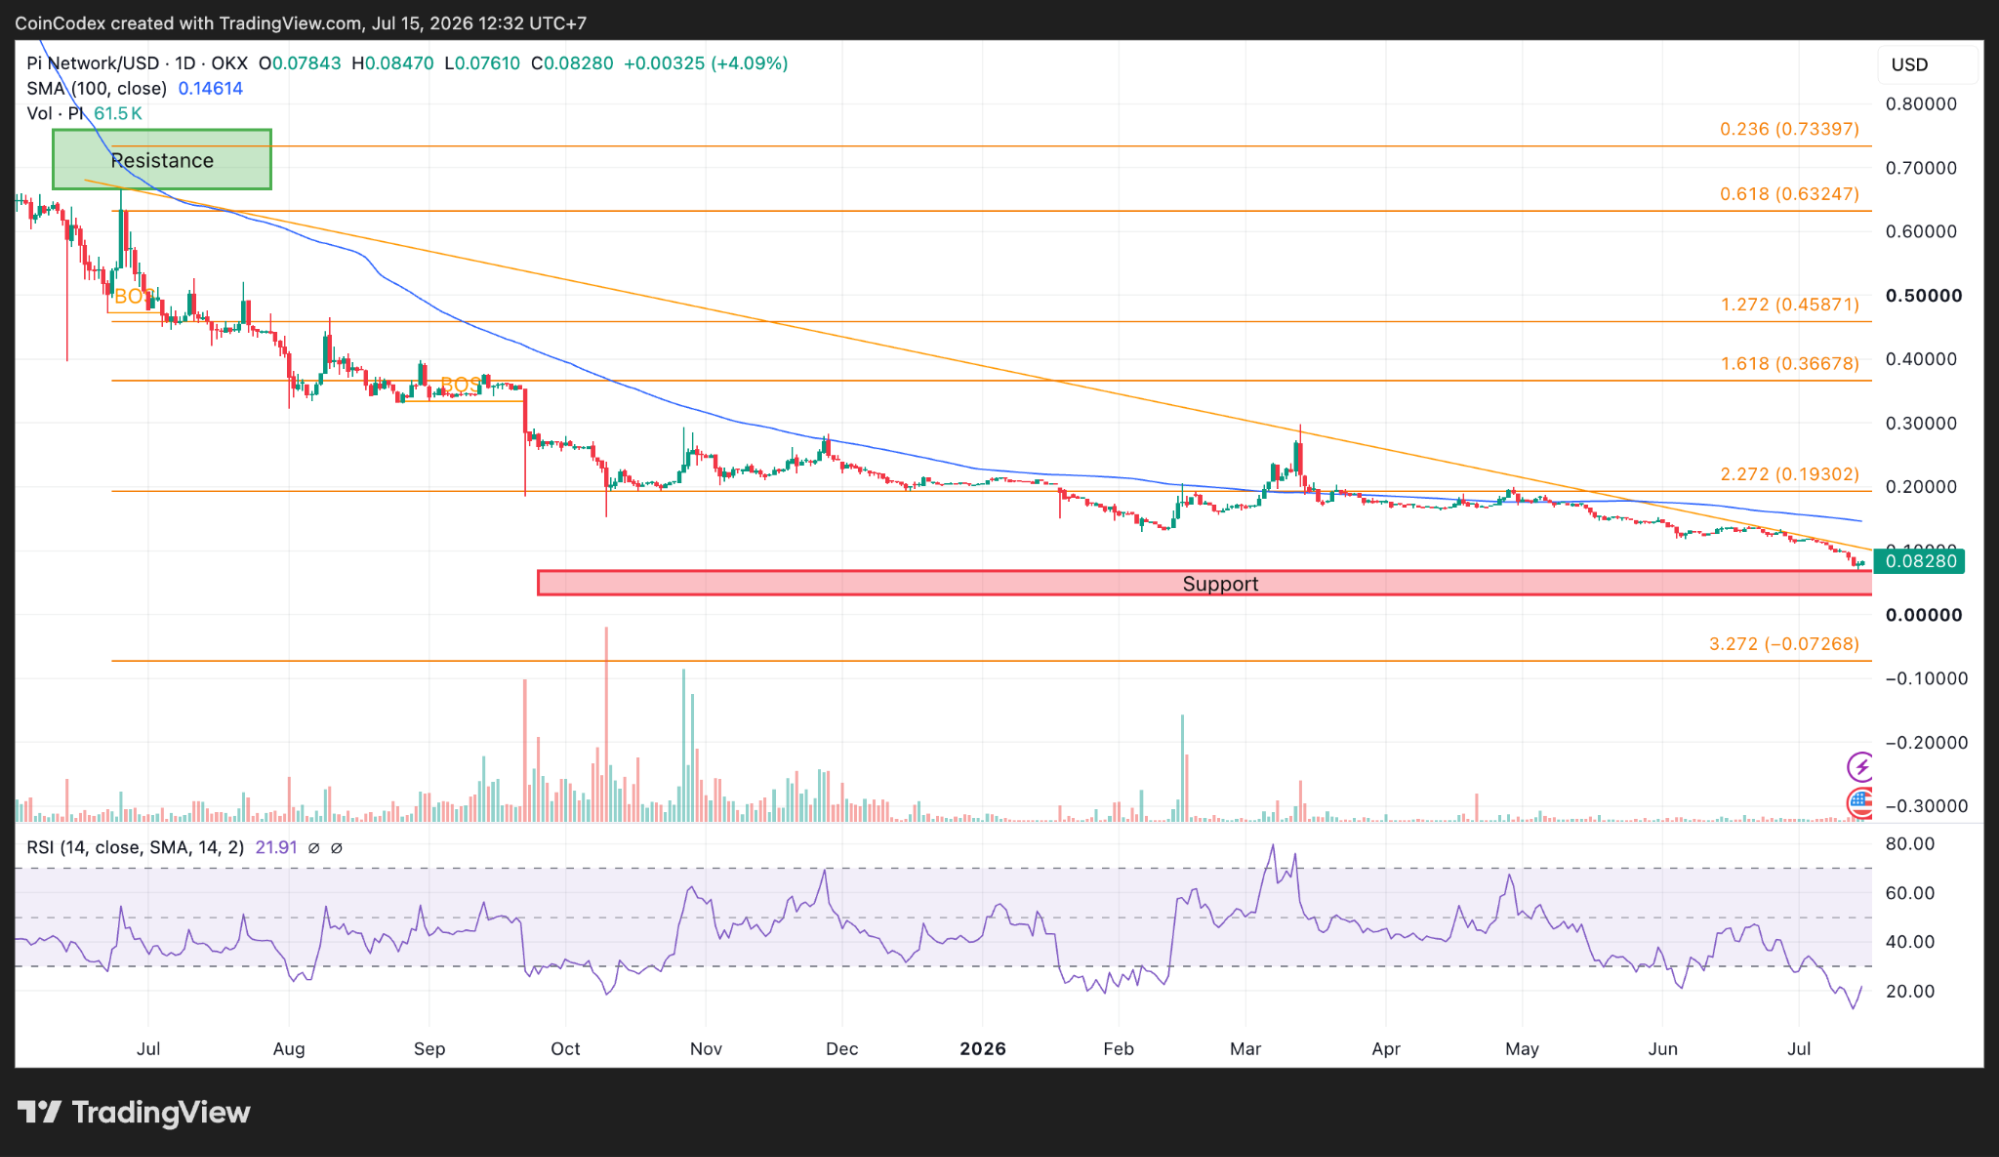
We had a look at both the daily and 4-hour PI charts, and they tell two slightly different stories. However, the situation on the daily chart remains bearish. PI price is trading at $0.0828, which is almost 43% under the 100-day simple moving average at $0.1461. The price stayed below the simple moving average from early 2026 and it keeps trending downwards.
Daily PI chart analysis
But one oscillator has started to catch attention. In particular, the RSI on the daily chart has moved to 21.91, which makes it oversold. Values below 30 for the RSI are seen as oversold and values below 25 occur quite rarely on the daily time frame. This means nothing for sure but it signals that the selling pressure was extreme.
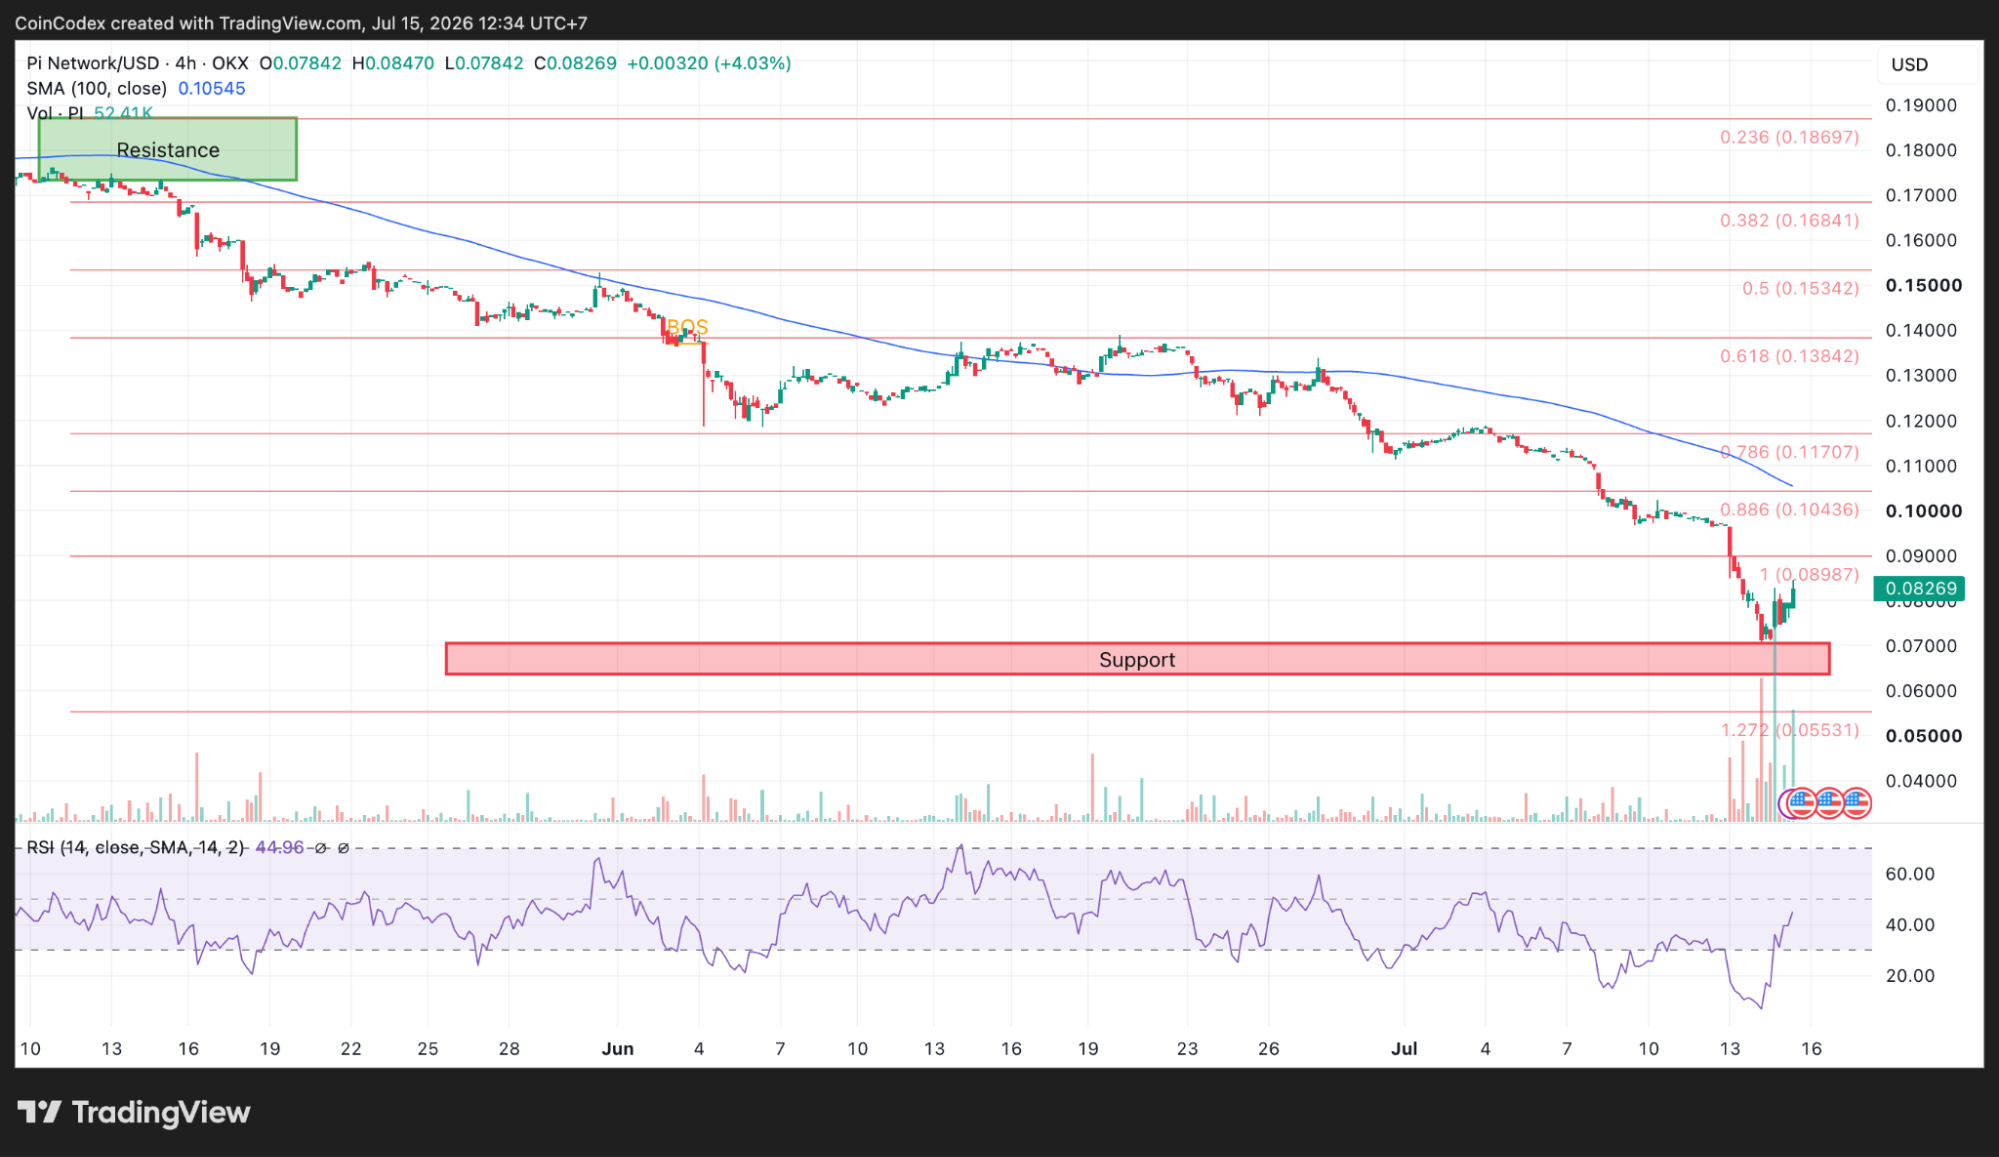
The shorter time frame has become slightly better. The PI price stays 21.6% under the 4-hour 100-period SMA at $0.1055, so buyers still have work to do. Even so, the 4-hour RSI has climbed to 44.96 after forming higher lows even as price continued making lower lows.
4-hour PI chart analysis
That type of divergence often appears when bearish momentum begins to weaken. The first resistance level comes in around $0.0847. If buyers can move above that level, the next targets become $0.09, $0.10 and then the 4-hour moving average near $0.1055.
PI market data still favors the bears
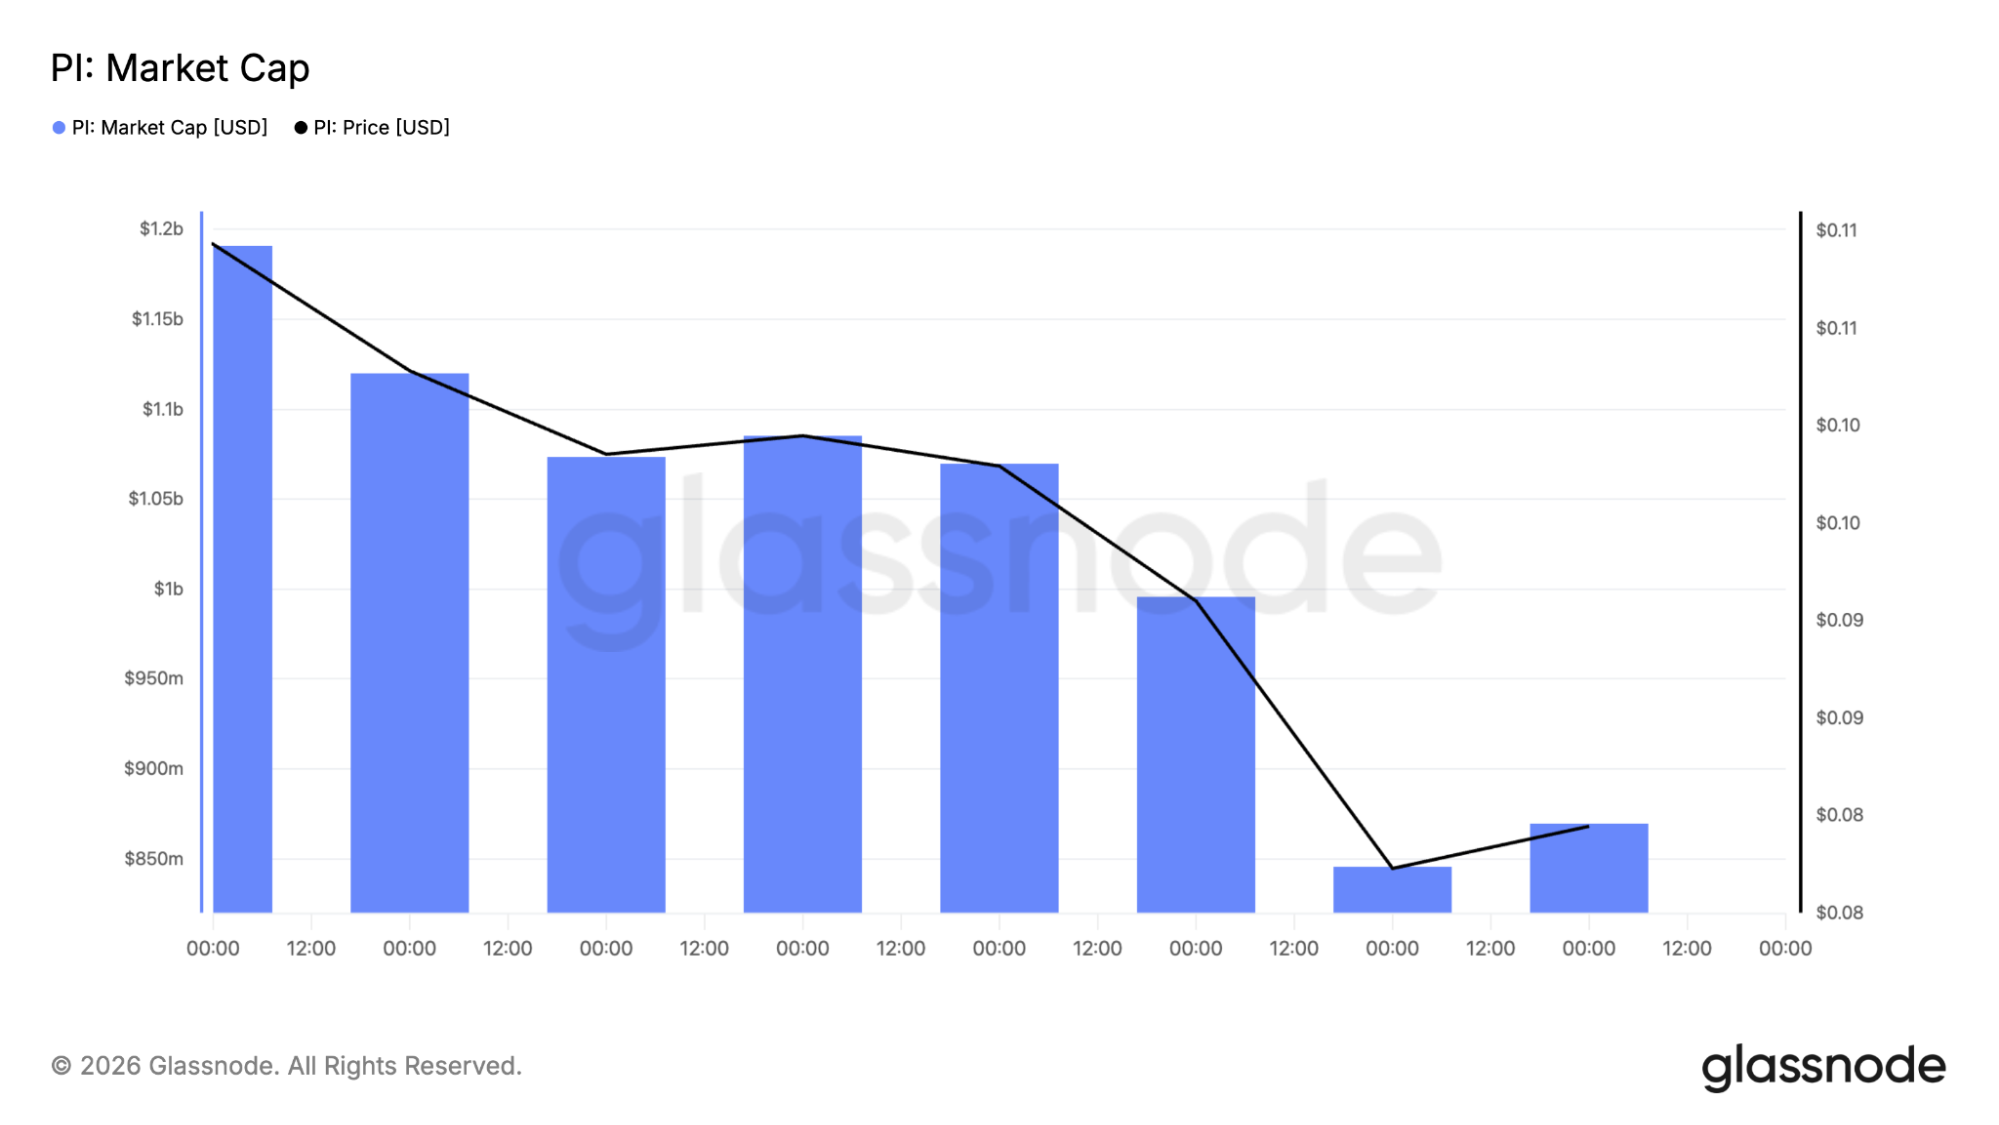
The on-chain data remains consistent with the weak price action. The market capitalization of Pi Network decreased from about $1.2 billion to about $850 million, which means a reduction by about 29% within the studied period. Within the studied period, the PI price fell from about $0.11 to about $0.08.
The Pi price is also about 97% lower than its all-time high of around $3.50 made at the end of 2025. In the measured period, the drawdown varied from about -96.3% to about -97.5%, showing that Pi remains far below its previous peak.
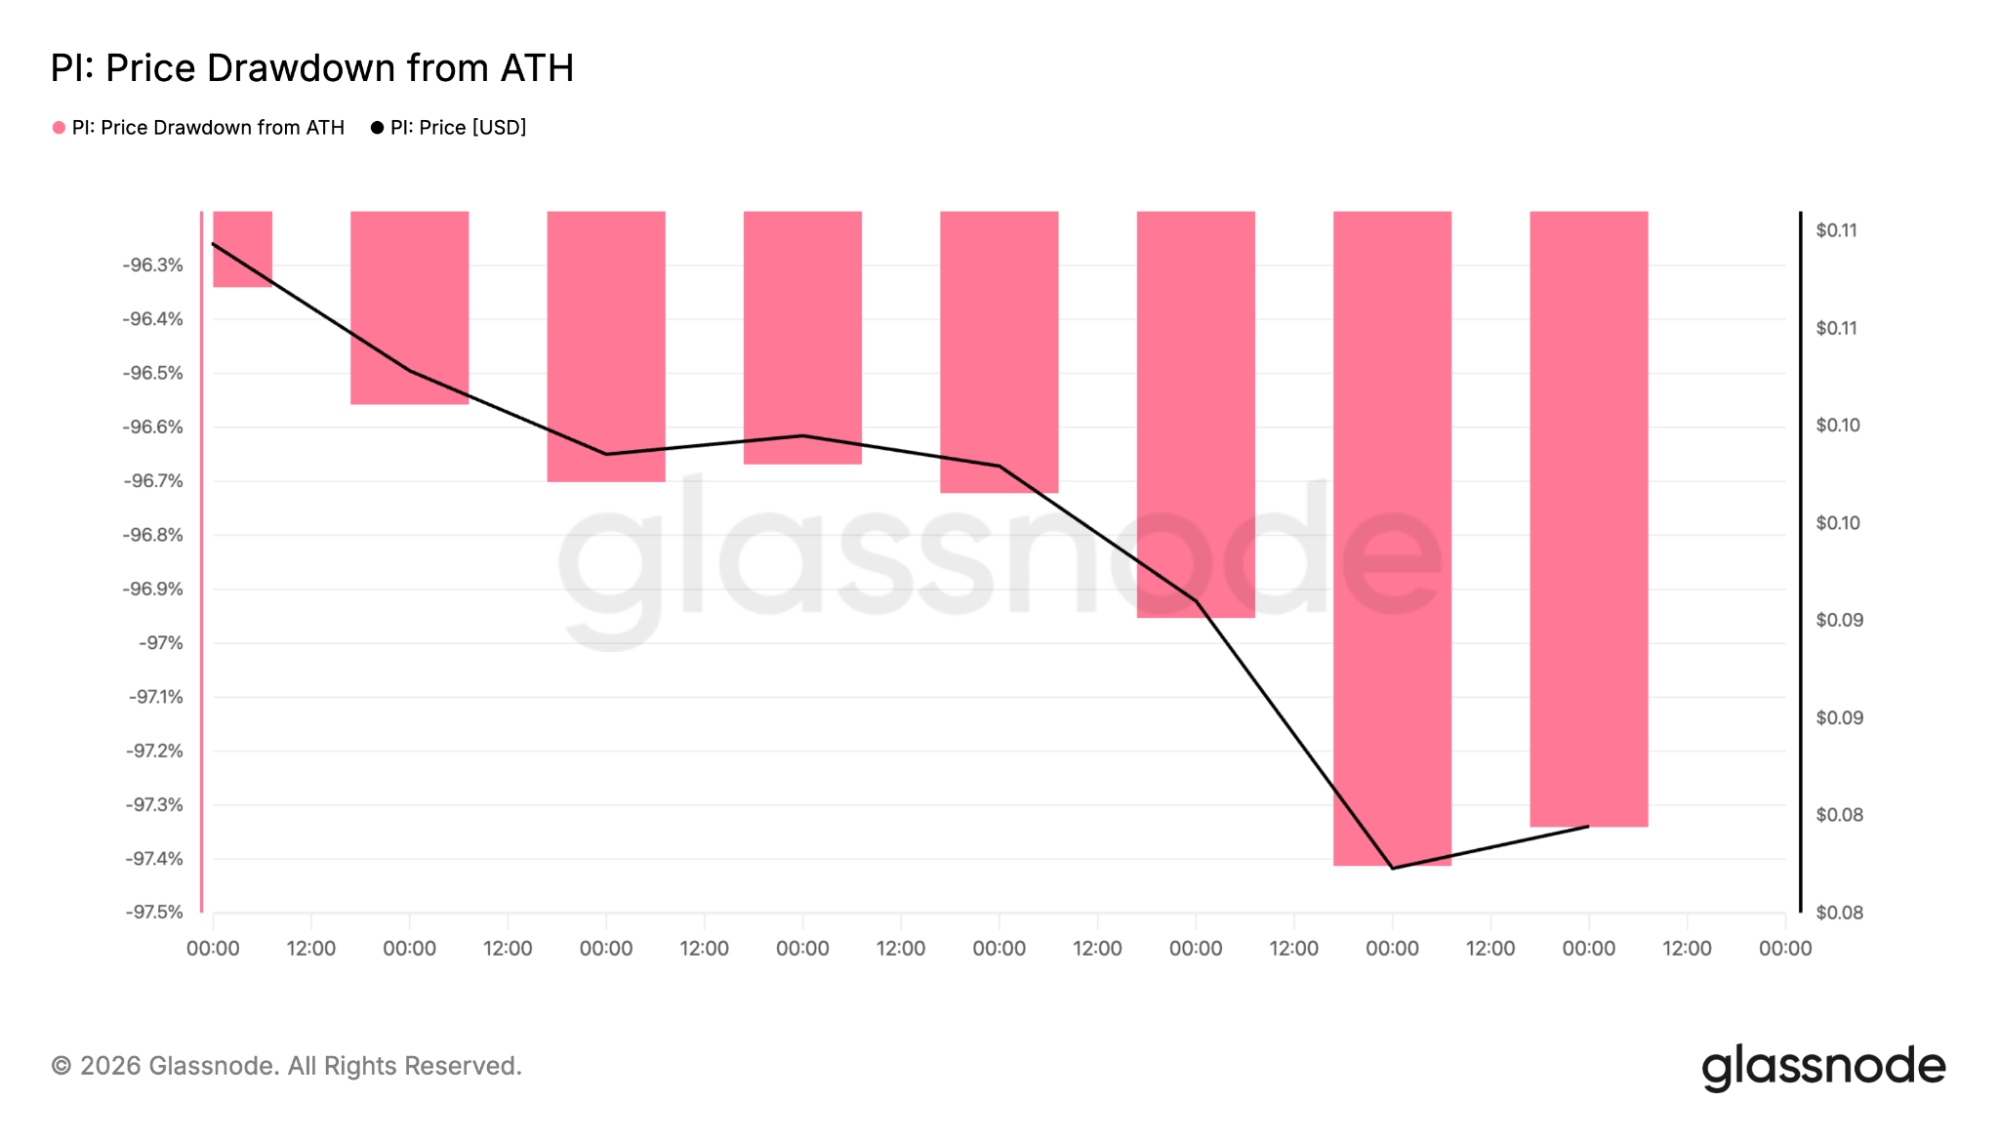
Those numbers indicate capital has continued leaving the project over the short period covered by the data. There are no clear signs of sustained accumulation yet, although the available data only covers a limited timeframe.
Pi Network continues expanding its ecosystem
Away from the charts, Pi Network is continuing to roll out new development tools. Pi App Studio now includes several AI-powered features that make it easier to build applications. Users can generate app logos with AI, create chatbot welcome messages using AI, and edit applications through AI-assisted workflows without needing advanced programming skills.
The most important one of all those is code upload/download capability. It means developers have a possibility to download the code of the created application, modify it with their favorite development environment, and upload back to App Studio. That gives developers greater flexibility without losing integration with Pi's ecosystem.
The platform has also expanded the number of apps each creator can manage to 100 while increasing testing limits to as much as 100 PI. The addition of new management pages, along with better organizing tools, helps developers in managing their various projects.
This is because of the upgrades that have been brought to Pi's development environment which have made it easier and more flexible for developers to build applications. Applications built using App Studio can incorporate Pi payments and digital identity into their operations.
What comes next for the PI price?
The PI price remains under pressure, but a few indicators are beginning to improve. The daily RSI near 22 points to deeply oversold conditions, and the bullish divergence on the 4-hour RSI shows that selling momentum has weakened compared to earlier in the decline.
Level one for the buyers to regain will be at $0.0847. If a breakthrough is made here, the price can move towards levels of $0.09 and $0.10. In addition, breaking out and regaining the 4-hour moving average level at $0.1055 can be positive for the market momentum.
If sellers regain control, support remains around $0.0784, followed by $0.075 and then $0.07. CoinCodex's 1-month PI price prediction places the price at $0.05857, implying potential downside from the current level.








