



Key highlights:
- Bitcoin exchange-to-exchange flows have dropped 91%, easing from 1,800 BTC to 166 BTC as European exchange migration slows
- BTC is still trading above the 4-hour 100-period SMA level, with $63,500 and $64,000 being the next resistance levels on the cards
- Spot US Bitcoin ETFs managed to end the streak of outflows in eight weeks by recording close to $200 million in net inflows
Bitcoin is at an interesting point. The BTC price is holding above short-term support, ETF investors have finally started putting money back into the market after eight straight weeks of withdrawals, and one on-chain metric is pointing to a slowdown in exchange liquidity.
Analyst Crypto Patel believes one overlooked signal deserves more attention. Exchange to exchange movements for Bitcoin have fallen from 1,800 BTC on June 14 to just 166 BTC by July 12, representing a fall of about 91%.
The previous spike in exchange to exchange movements is likely attributable to Binance losing access to the EU market following the enforcement of MiCA regulations, resulting in European users moving to MiCA-compliant crypto exchanges. The migration process having been completed, exchange movements have been greatly reduced.
The chart analysis is quite contrasting, showing a positive short term price action while the overall trend remains bearish until certain key resistance levels are overcome by Bitcoin.
Bitcoin exchange flows have fallen dramatically
Crypto Patel's data focuses on one metric that many traders overlook: Bitcoin moving between exchanges. Exchange-to-exchange volume represents the amount of BTC movement between one exchange and another.
It usually rises when there is significant arbitrage activity, institutional rebalancing, or liquidity reallocation. In the month before July 12, this flow reduced from 1,800 BTC to just 166 BTC, which represents a reduction of almost 91%.
The Bitcoin Signal Almost Everyone Missed.$BTC Exchange-to-Exchange Flow Just Crashed 91% In 30 Days.
➡️ June 14: 1,800 BTC
➡️ July 12: 166 BTC
This Wasn't Random.
It Happened As Binance Lost Access To The EU Under MiCA, Triggering A Massive Migration Of European Users To… pic.twitter.com/uVVcrgwcGR— Crypto Patel (@CryptoPatel) July 12, 2026
Patel argues the decline lines up with Binance's loss of access to the European Union under MiCA rules. As European users completed their migration to regulated exchanges, much of the abnormal exchange activity faded.
His view is that Bitcoin may struggle to produce a sustained breakout until exchange-to-exchange flows consistently recover above the 800-1,000 BTC range. That would indicate liquidity has settled into its new structure and trading activity is expanding again.
The BTC price is holding above short-term support
We had a look at the 4-hour and daily bitcoin charts and observed that while the daily trend is bearish, the near-term trend looks more bullish. On the 4-hour chart, the price of Bitcoin is currently trading at $62,917, which is 1.6% above the 100-period SMA of $61,940.
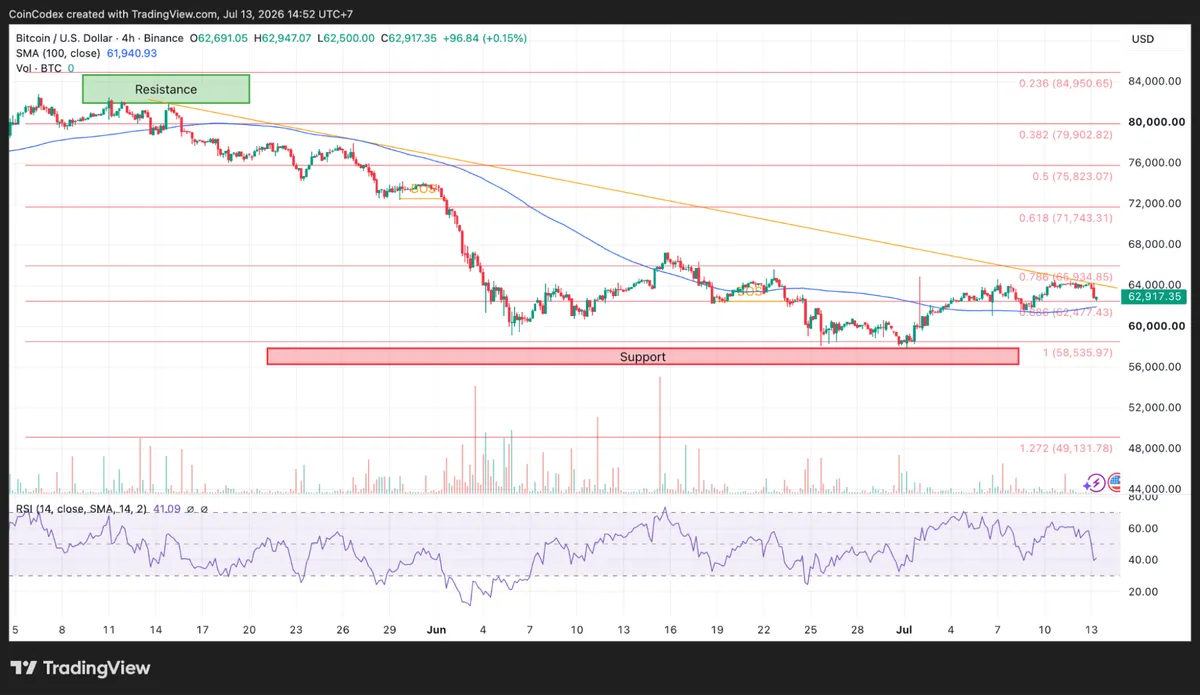
4-hour BTC chart analysis
It means that while bulls still have a slight upper hand, the momentum remains muted for now. The current 4-hour RSI of 41.09 can increase further if buying momentum picks up again. The key levels of resistance to watch out for are $62,947, $63,500, and $64,000.
The daily chart poses even more difficulty. The BTC price is trading at 11% below the 100-day SMA, which stands at $70,695. This indicates that the overall downtrend is currently still in place.
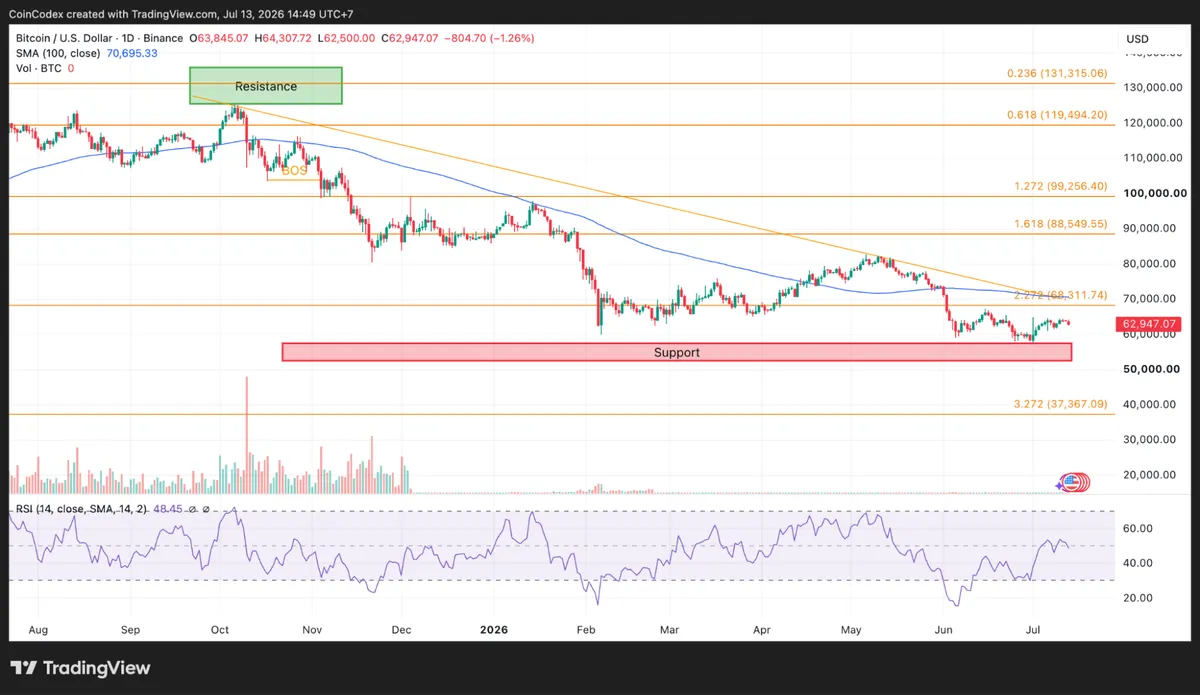
Daily BTC chart analysis
However, the daily RSI has reached 48.45 and is continuing to form higher lows amid lower price lows. This bullish divergence usually signals decreasing selling pressure; but a breakout is still needed.
Stable network activity offers Bitcoin some support
However, on-chain analysis data by Glassnode tells us a different story compared to the price. The daily active Bitcoin addresses have been within the range of around 640,000 to 660,000 during the period analyzed, while the price of BTC dropped from $53,800 to $52,200.
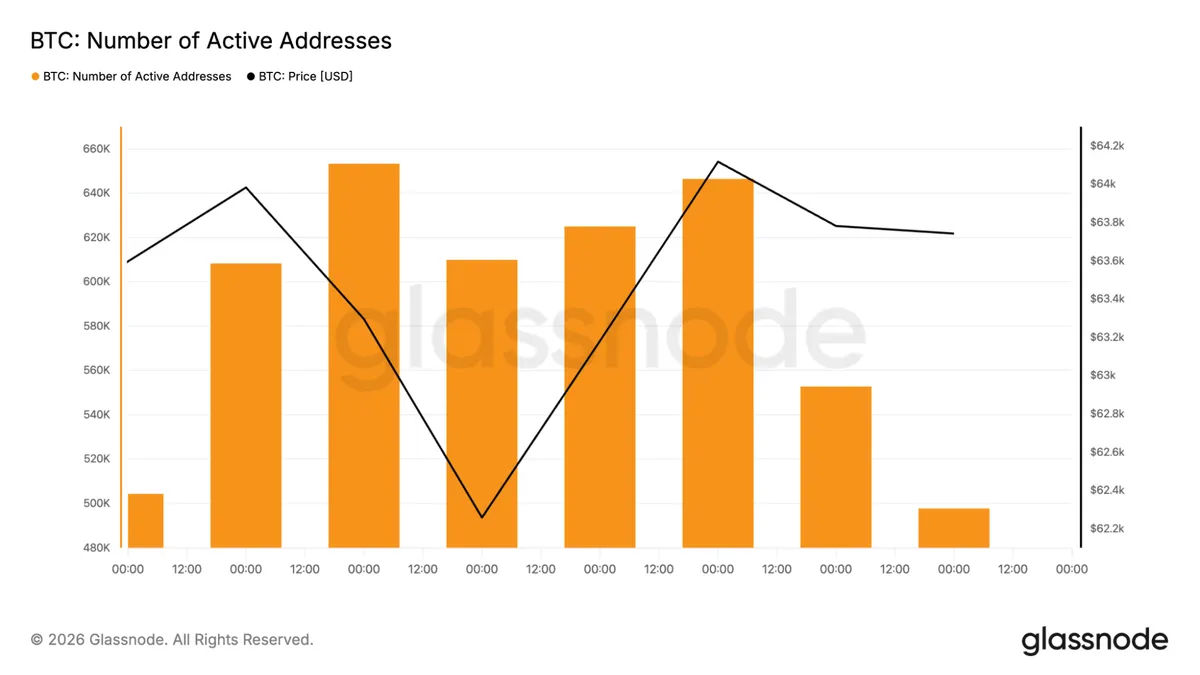
This is very important because it indicates that people are actively using the network despite the lack of bullish price behavior. During strong bull market periods, Bitcoin has registered daily active addresses within the range of 800,000 to 1,000,000.
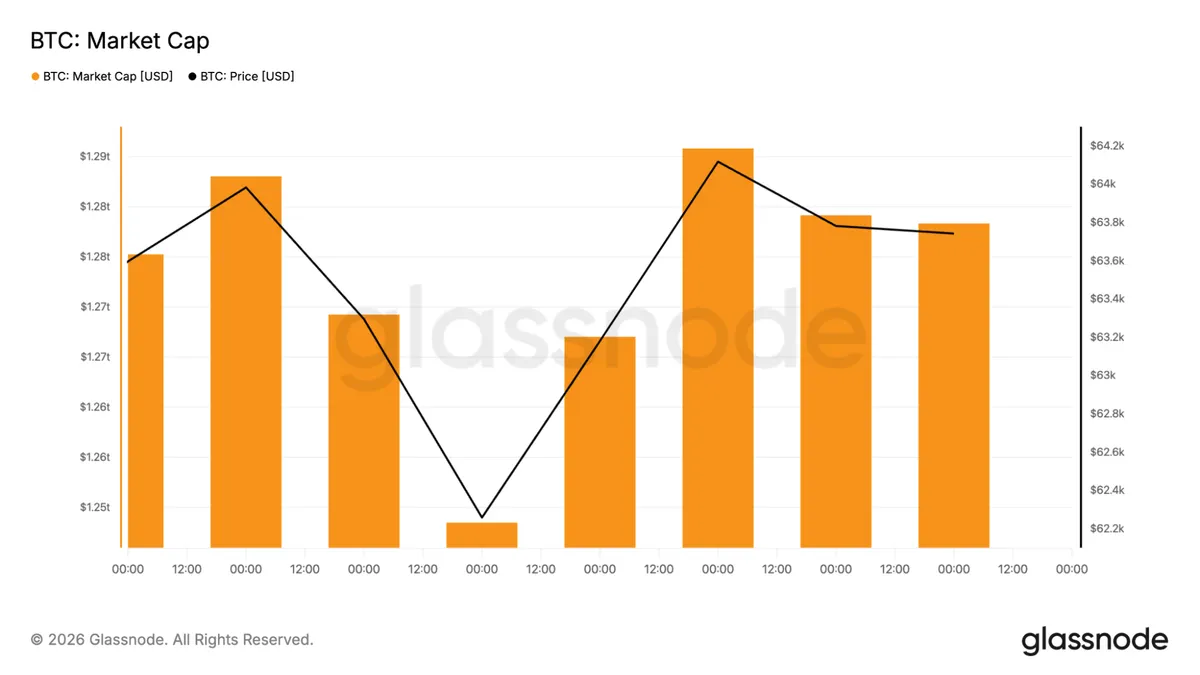
The present range falls below those levels, but it remains comfortably above the lows typically associated with weaker network participation. BTC Market capitalization also recovered after falling toward $1.245 trillion. It has since returned to roughly $1.28 trillion, matching the improvement in price and pointing to fresh capital returning after June's weakness.
Bitcoin ETF investors are buying again
Institutional flows have also improved after months of selling. Net outflows in US listed Bitcoin ETFs continued for eight consecutive weeks in a row, with around $8 billion flowing out of such products from mid-May to early July.
The overall assets under management of the ETFs fell from around $102.6 billion to about $78 billion. But last week marked an end to the trend, with almost $200 million flowing into them. That doesn't erase the previous withdrawals, but it does mark the first positive week in nearly two months.
Much of the buying came through BlackRock's IBIT, although traders will be watching closely to see whether inflows begin spreading across more ETF issuers over the coming weeks. If inflows continue, ETF demand could become another source of support for the BTC price.
What comes next for the BTC price?
Bitcoin has several encouraging developments working in its favor. Exchange-to-exchange flows have normalized after the European migration between exchanges, active addresses remain stable, market capitalization has recovered from June's lows, and ETF investors have finally returned after eight weeks of persistent selling.
Nevertheless, it is clear from the graphs that much work needs to be done. As long as the price of BTC stays above the 4-hour moving average of $61,940, buyers will maintain short-term dominance.
A break above $62,947 will open up the levels of $63,500 and $64,000, while $64,308 would be the next resistance point. However, the more difficult task is to close above the daily 100-day moving average of $70,695. Until Bitcoin closes above that level, the broader trend has yet to fully improve.
CoinCodex's 1-month BTC price prediction places the price at $66,354, pointing to modest upside from current levels if buyers can defend support around $61,940 and reclaim the $63,500-$64,000 resistance zone.









